China's economy continues its transition
Data on China's economy in 2016 confirm the continuation of several key trends. In an earlier Data Insight we discussed the 2016 data largely in terms of the economic cycle and outlook for 2017. Here we take a step back and highlight and review a number of medium-term trends that characterize China’s transition. They capture a shift towards a larger role for services and consumption, steady urbanization, declining importance of external trade and movement up the value chain. We expect all those trends to continue in the coming decade.
Key trends in the domestic economy
Real GDP growth continued to ease but remained solid. It fell from 6.9 percent in 2015 to 6.7 percent in 2016. This is a far cry from the 9.8 percent average growth as recently as in 2008-11. Still, China remains one of the fastest growing major economies and contributed 45 percent of global GDP growth last year. Nominal GDP growth picked up in 2016, as a period of deflation in industry came to an end in the fall - it was 8 percent for the year as a whole and a hefty 9.6 percent in Q4. With GDP per capita reaching $8,100 last year, the overall economy was 60 percent of that in the US in 2016, compared to 21 percent 10 years ago.
Rebalancing and transformation continued last year with both services and consumption growing at an impressive clip. Service sector value added rose 7.8 percent in real terms in 2016, compared to 6.1 percent for the secondary sector (industry, construction and mining). On top of that, prices continued to rise significantly faster in services than in industry. In all, the share of services in GDP rose from 50.2 percent to 51.6 percent, still relatively low in international comparison but around 10 ppt higher than 10 years ago. The expansion of the service sector remained brisk across the board. But growth of value added in the financial industry was relatively subdued following the stock market turmoil in early 2016.
Consumption grew significantly faster than investment. While real household disposable income growth slowed from 7.8 percent in 2015 to 6.7 percent in 2016, real household consumption slowed by only 0.3 ppt, to 7.1 percent, with spending on sports and recreational goods, medicine, furniture and “construction and decoration material” particularly strong. With government consumption also buoyant, overall consumption grew 8.3 percent. Meanwhile, we estimate that, after a stimulus-induced pick up in 2015, real growth of fixed investment fell to 6.2 percent last year (Chart 1). With consumption prices also outpacing those of investment, the share of consumption in GDP rose to an estimated 53.2 percent, 5 ppt higher than the trough in 2010.
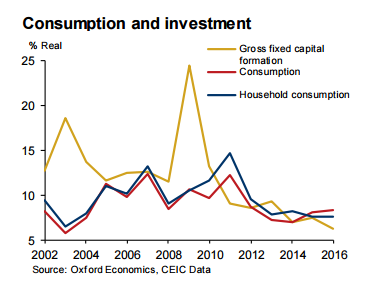
Having said this, fixed investment remains very high at a bit under 43 percent of GDP last year – down 1 ppt from 2015, we estimate – leading to a rise in the capital stock of 9 percent and a further nudge up in the capital/output ratio to 3.3 (in prices of 2010). While continued capital deepening helps raise the economy’s productive capacity and labor productivity – which was up 6.5 percent in 2016 – it also increases the risk of over-investment and puts pressure on rates of return. Indeed, reducing excess capacity in heavy industry remains a key challenge in 2017. Moreover, the rapid credit growth associated with high investment is not sustainable and will eventually have to be reined in. The (mild) change in tone on the macroeconomic policy stance for 2017 is in recognition of that fact.
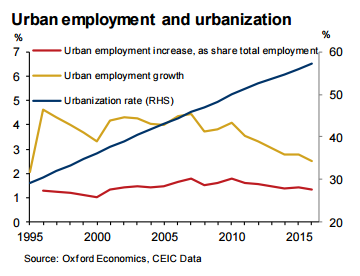
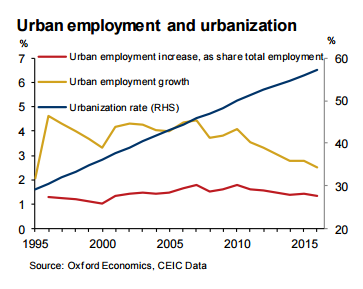
Overall employment rose only 0.2 percent and should soon turn negative as demographic pressures are a drag on the working age population. However, the real action on China’s labor market is on the rural-urban nexus. The pace of urban job growth continued to ease in 2016, to 2.5 percent. But the secular rise in the level of urban employment means that, in terms of the number of people or as a share of total employment, the slowdown is quite mild (Chart 2). The same is true if we look at the population data (instead of employment). As a result, the urbanization rate has continued to rise steadily by a bit more than 1 ppt per year, reaching 57.3 percent in 2016 (from 44.3 percent 10 years ago).
In other words, in terms of the impact on the overall economy and transition, the pace of urbanization has not slowed much in recent years. This matters since urbanization is key to rebalancing, as it boosts the services sector and consumption.
Key trends in external trade
External trade developments have been blurred in recent years by large price changes. But by stripping out price changes we get a clear picture of the key trends in terms of the importance of external trade to China’s economy overall and the behavior of export and import volumes.
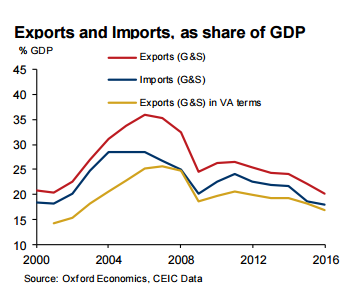
The share of external trade in GDP continued to trend down in 2016 after peaking in the mid-2000s (Chart 3). The decline was less pronounced for imports than for exports. That is why China’s current account surplus declined from a peak of 9.9 percent of GDP in 2007 to around 2 percent in 2016. The fall in exports is less pronounced if we look at the domestic value added content of in exports (excluding imported components) rather than at gross exports. In any case, the main reason for the diminishing share of external trade in the last 10 years is that prices of exports and imports lagged domestic prices by a large margin, which is to be expected in a rapidly growing country with strong productivity growth in its tradable sector.
The domestic value added content of (total) exports was around 17 percent of GDP in 2016, compared to total gross exports of 20 percent. In all, China’s economy has increasingly become mainly dependent on domestic demand, a fact not always appreciated. Total gross exports were 12 percent of GDP in the US last year, 16 percent in Japan and 19 percent in India.
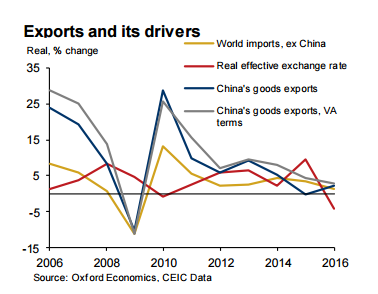
Real export growth picked up somewhat in 2016 but remained much lower than in the 2000s. As Chart 4 shows, relatively slow growth of global trade has been a drag in recent years. Moreover, the extent to which China’s exporters gain global market share has declined significantly. In 2014-16, China’s exports (of goods) outgrew partner country import demand by only 0.4 ppt, compared to 17 ppt in 2004-06, in real terms. In 2015, when China’s REER appreciated sharply, its exports even lost some global market share, in terms of gross exports (not in terms of domestic value added content). That market share loss was recouped in 2016, even though surprisingly, exports weakened in Q4.
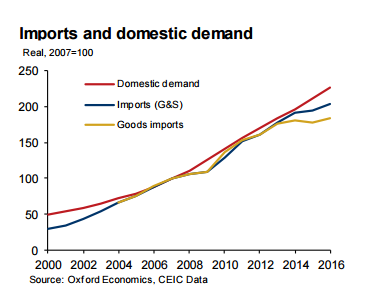
Real import growth picked up in 2016, but continued to lag behind domestic demand growth. Real imports of goods and services held up pace with China’s rapidly expanding domestic demand from 2008 to 2014, but trailed demand in 2015-16 (Chart 5). This includes imports of services, which have grown by leaps and bounds in the last six years, according to the balance of payment data. Goods imports (for which the data is arguably more consistent over time than that for services imports), started to significantly lag behind domestic demand already in 2014 (Chart 5).
This slowdown in import volume growth, after a long period of rapid expansion, has been clearly felt across the globe. Indeed, it fueled the concerns among some observers that China’s economy was slowing much more strongly in recent years than the official data suggests (in our view, GDP growth in 2015 was around 0.6 ppt lower than the official estimate, but the gap narrowed to around 0.3 ppt in 2016).
There are a number economic reasons why imports, especially those of goods, have slowed so significantly in recent years. One is the investment slowdown noted above. China’s investment is highly import-intensive, and the slowdown in investment hit imports substantially. While the impact of the slowdown in investment on overall growth has in large part been offset by solid consumption growth, consumption is much less import intensive. Second, in early 2015 a significant inventory correction exerted a major drag on imports, notably of raw commodities. This sudden contraction masked a more gradual underlying trend towards lower commodity intensity of China’s growth given the rebalancing and transition of the economy.
Third, as China has been improving its industrial structure and moving up the value chain, companies and individuals have been switching from buying imported components and goods to sourcing domestically. This includes companies in export-oriented manufacturing, leading to the increase in domestic value added content of exports noted above. At the level of final domestic demand (consumption and investment spending), domestic companies also have made inroads competing with imports and/or foreign brands. Notable recent examples include smartphones, SUV cars and instant noodles.
These trends should continue in the coming years
The trends we have described here are medium-term ones, not cyclical. We expect them to persist in the coming years and to remain key aspects of our outlook for China.
Specifically, we expect GDP growth to continue to ease gradually in the coming years but remain solid, reaching 6.3 percent in 2017 and 5.7 percent in 2020. We forecast continued rebalancing, with the share of services in GDP rising by 3.2 ppt to almost 55 percent in 2020 and that of consumption by 1.2 ppt to 55 percent. We expect urbanization to continue broadly at the pace in recent years. While we forecast a mild pick up in export growth this year we expect shipments to remain constrained by only modest global trade growth, while market share gains are unlikely to be large in the coming years. And we expect import growth to continue to lag domestic demand as rebalancing, transition and movement up the value chain continue.
The author is the Hong Kong-based head of Asia economics for Oxford Economics. The opinions of the author don't represent those of China Daily website.