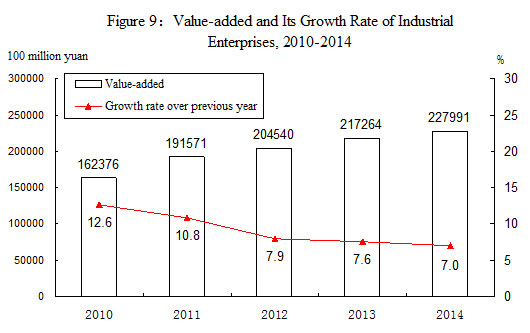
III. Industry and Construction
The industrial production grew steadily. In 2014, the total value added of the industrial sector was 22,799.1 billion yuan, up by 7.0 percent over the previous year. The value added of industrial enterprises above the designated size increased by 8.3 percent. Of the industrial enterprises above the designated size, in terms of ownership, the value added of the state-owned and state-holding enterprises grew by 4.9 percent, that of the collective enterprises went up by 1.7 percent, that of the share-holding enterprises increased by 9.7 percent, that of the enterprises by foreign investors and investors from Hong Kong, Macao and Taiwan soared by 6.3 percent and that of private enterprises grew by 10.2 percent. In terms of the sectors, the value added of the mining industry grew by 4.5 percent, that of manufacturing by 9.4 percent and that of the production and supply of electric power, heat power, gas and water by 3.2 percent.
 |
In 2014, of the industrial enterprises above designated size, the growth of value added for processing of food from agricultural products was 7.7 percent over the previous year; for textile industry was 6.7 percent; for manufacture of general machinery 9.1 percent; for manufacture of special purpose machinery 6.9 percent; for manufacture of automobiles 11.8 percent; for manufacture of computers, communication equipment and other electronic equipment 12.2 percent and for manufacture of electrical machinery and equipment 9.4 percent. The growth of the value added for the major six high energy consuming industries was 7.5 percent, of which, that of the manufacture of non-metallic mineral products was 9.3 percent, manufacture of raw chemical materials and chemical products 10.3 percent, smelting and pressing of non-ferrous metals 12.4 percent, smelting and pressing of ferrous metals 6.2 percent, production and supply of electric power and heat power 2.2 percent and 5.4 percent for processing of petroleum, coking, processing of nuclear fuel. The value added growth for the high technology manufacturing industry[9] was 12.3 percent over the previous year, accounting for 10.6 percent of that of industrial enterprises above designated size. The value added growth for manufacturing of equipment[10] was 10.5 percent, accounting for 30.4 percent of that of industrial enterprises above designated size.
|
Table 3: Output of Major Industrial Products and the Growth Rates in 2014[1] |
|||
|
Product |
Unit |
Output |
Increase over 2013 (%) |
|
Yarn |
10000 tons |
3379.2 |
5.6 |
|
Cloth |
100 million meters |
893.7 |
-0.4 |
|
Chemical fibers |
10000 tons |
4389.8 |
5.5 |
|
Sugar (final product) |
10000 tons |
1642.7 |
3.1 |
|
Cigarettes |
100 million |
26098.5 |
1.9 |
|
Color TV sets |
10000 |
14128.9 |
10.9 |
|
Of which: LCD TV sets |
10000 |
13865.9 |
13.3 |
|
Household refrigerators |
10000 |
8796.1 |
-5.0 |
|
Room air conditioners |
10000 |
14463.3 |
10.7 |
|
Total primary energy production |
100 million tons of standard coal equivalent |
36.0 |
0.5 |
|
Coal |
100 million tons |
38.7 |
-2.5 |
|
Crude oil |
100 million tons |
21142.9 |
0.7 |
|
Natural gas |
100 million cubic meters |
1301.6 |
7.7 |
|
Electricity |
100 million kilowatt-hours |
56495.8 |
4.0 |
|
Of which: Thermal-power |
100 million kilowatt-hours |
42337.3 |
-0.3 |
|
Hydro-power |
100 million kilowatt-hours |
10643.4 |
15.7 |
|
Nuclear-power |
100 million kilowatt-hours |
1325.4 |
18.8 |
|
Crude steel |
10000 tons |
82269.8 |
1.2 |
|
Rolled steel |
10000 tons |
112557.2 |
4.0 |
|
Ten kinds of nonferrous metals |
10000 tons |
4380.1 |
7.4 |
|
Of which: Refined copper (copper) |
10000 tons |
764.4 |
15.0 |
|
Aluminum electrolyze |
10000 tons |
2435.8 |
10.3 |
|
Aluminum oxide |
10000 tons |
4777.3 |
7.3 |
|
Cement |
100 million tons |
24.8 |
2.3 |
|
Sulfuric acid (100%) |
10000 tons |
8846.3 |
8.5 |
|
Soda ash |
10000 tons |
2514.2 |
3.4 |
|
Caustic soda (100%) |
10000 tons |
3059.0 |
4.5 |
|
Ethylene |
10000 tons |
1696.7 |
6.1 |
|
Chemical fertilizers (100 percent equivalent) |
10000 tons |
6887.2 |
-2.0 |
|
Power-generating equipment |
10000 kilowatts |
15053.0 |
6.0 |
|
Motor vehicles |
10000 |
2372.5 |
7.3 |
|
Of which: Basic passenger cars (cars) |
10000 |
1248.3 |
3.1 |
|
Large & medium tractors |
10000 |
64.4 |
-3.3 |
|
Integrated circuits |
100 million pieces |
1015.5 |
12.4 |
|
Program-controlled switchboards |
10000 lines |
3123.1 |
15.7 |
|
Mobile telephones |
10000 |
162719.8 |
6.8 |
|
Micro-computers |
10000 |
35079.6 |
-0.8 |
By the end of 2014, the installed power generation capacity was 1,360.19 million kilowatts, up by 8.7 percent over that of the previous year, among which[11] the installed thermal power generation capacity was 915.69 million kilowatts, up by 5.9 percent; the installed hydropower generation capacity was 301.83 million kilowatts, up by 7.9 percent; the installed nuclear power generation capacity was 19.88 million kilowatts, up by 36.1 percent. The installed grid-connected wind power generation capacity was 95.81 million kilowatts, up by 25.6 percent and the installed grid-connected solar power generation capacity was 26.52 million kilowatts, an increase of 67.0 percent.
Copyright 1995 - . All rights reserved. The content (including but not limited to text, photo, multimedia information, etc) published in this site belongs to China Daily Information Co (CDIC). Without written authorization from CDIC, such content shall not be republished or used in any form. Note: Browsers with 1024*768 or higher resolution are suggested for this site.
License for publishing multimedia online 0108263 Registration Number: 130349 ![]()