VI. Foreign Economic Relations[17]
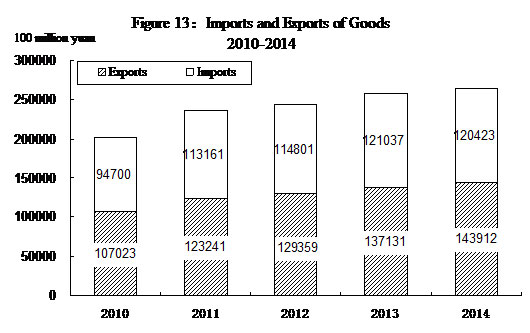
The total value of imports and exports of goods in 2014 reached 26,433.4 billion yuan, up by 2.3 percent over the previous year. Of this total, the value of goods exported was 14,391.2 billion yuan, increased by 4.9 percent, and the value of goods imported was 12,042.3 billion yuan, down by 0.6 percent. The balance of imports and exports (exports minus imports) was 2,348.9 billion yuan, an increase of 739.5 billion yuan over the previous year.
 |
| 图片说明 |
|
Table 7: Total Value of Import and Export of Goods and the Growth Rates |
||
|
in 2014 |
||
|
Item |
Value (100 million yuan) |
Increase over 2013 (%) |
|
Total import and export of goods |
264334 |
2.3 |
|
Exports |
143912 |
4.9 |
|
Of which: General trade |
73944 |
9.6 |
|
Processing trade |
54320 |
1.8 |
|
Of which: Mechanical and electronic products |
80527 |
2.6 |
|
High & new technology products |
40570 |
-1.0 |
|
Imports |
120423 |
-0.6 |
|
Of which: General trade |
68162 |
-1.0 |
|
Processing trade |
32211 |
4.5 |
|
Of which: Mechanical and electronic products |
52509 |
0.7 |
|
High & new technology products |
33876 |
-2.2 |
|
Trade surplus (exports minus imports) |
23489 |
— |
|
Table 8: Main Export Commodities in Volume and Value and the Growth Rates in 2014 |
|||||
|
Item |
Unit |
Volume
|
Increase over 2013 (%) |
Value (100 million USD) |
Increase over 2013 (%) |
|
Coal (including lignite) |
10000 tons |
574 |
-23.5 |
43 |
-35.5 |
|
Rolled steel |
10000 tons |
9378 |
50.5 |
4350 |
31.6 |
|
Textile yarns and textile articles |
---- |
— |
— |
6888 |
3.8 |
|
Clothes and clothing accessories |
---- |
— |
— |
11445 |
4.2 |
|
Footwear |
---- |
— |
— |
3455 |
9.7 |
|
Furniture and parts |
---- |
— |
— |
3195 |
-0.7 |
|
Automatic data processing machines and components |
10000 sets |
191836 |
2.6 |
11159 |
-1.3 |
|
Handheld mobiles and car telephones |
10000 sets |
131199 |
10.6 |
7085 |
20.2 |
|
Containers |
10000 units |
302 |
12.1 |
553 |
13.0 |
|
Liquid crystal display panels |
10000 units |
245080 |
-25.0 |
1952 |
-12.4 |
|
Motor vehicles |
10000 sets |
90 |
-2.8 |
770 |
3.5 |
|
Table 9: Main Import Commodities in Volume and Value and the Growth Rates in 2014 |
||||
|
Item |
Volume (10000 tons) |
Increase over 2013 (%) |
Value (100 million yuan) |
Increase over 2013 (%) |
|
Cereals and cereal flour |
1951 |
33.8 |
382 |
20.7 |
|
Soybean |
7140 |
12.7 |
2474 |
5.0 |
|
Edible vegetable oil |
650 |
-19.7 |
364 |
-27.3 |
|
Iron ore and concentrate |
93251 |
13.8 |
5748 |
-12.8 |
|
Aluminum oxide |
528 |
37.7 |
118 |
35.5 |
|
Coal (including lignite) |
29122 |
-10.9 |
1366 |
-24.4 |
|
Crude oil |
30838 |
9.5 |
14017 |
2.8 |
|
Petroleum products refined |
3000 |
-24.2 |
1439 |
-27.7 |
|
Plastics in primary forms |
2535 |
3.0 |
3167 |
4.0 |
|
Paper pulp |
1796 |
6.6 |
741 |
4.9 |
|
Rolled steel |
1443 |
2.5 |
1101 |
4.0 |
|
Copper and copper alloys |
483 |
7.4 |
2188 |
0.8 |
|
Table 10: Imports and Exports by Major Countries and Regions and the Growth Rates in 2014 |
||||
|
Country or region |
Exports (100 million yuan) |
Increase over 2013 (%) |
Imports (100 million yuan) |
Increase over 2013 (%) |
|
European Union |
22787 |
8.3 |
15031 |
9.7 |
|
United States |
24328 |
6.4 |
9764 |
3.1 |
|
ASEAN |
16712 |
10.3 |
12794 |
3.3 |
|
Hong Kong, China |
22307 |
-6.6 |
792 |
-21.5 |
|
Japan |
9187 |
-1.4 |
10027 |
-0.5 |
|
Republic of Korea |
6162 |
8.9 |
11677 |
2.8 |
|
Taiwan, China |
2843 |
12.7 |
9337 |
-3.9 |
|
Russia |
3297 |
7.2 |
2555 |
3.7 |
|
India |
3331 |
10.7 |
1005 |
-4.6 |
The total value of imports and exports of services[18] in 2014 was 604.3 billion US dollars, up by 12.6 percent. The export value of services was 222.2 billion US dollars, up by 7.6 percent. The import value of services was 382.1 billion US dollars, up by 15.8 percent. The deficit of exports minus imports of services was 159.9 billion US dollars.
The year 2014 witnessed the establishment of 23,778 enterprises with foreign direct investment in non-financial sectors, up by 4.4 percent over the previous year; and the foreign capital actually utilized was 736.4 billion US dollars, or 119.6 billion US dollars, up by 1.7 percent.
|
Table 11: Total Value of Foreign Direct Investment in Non-financial Sectors and the Growth Rates in 2014 |
||||
|
Sector |
Enterprises |
Increase over 2013 (%) |
Actually Utilized Value ($100 m) |
Increase over 2013 (%) |
|
Total |
23778 |
4.4 |
1195.6 |
1.7 |
|
Of which: Agriculture, Forestry, Animal Husbandry and Fishing |
719 |
-5.0 |
15.2 |
-15.4 |
|
Manufacturing |
5178 |
-20.4 |
399.4 |
-12.3 |
|
Production and Supply of Electricity, Gas and Water |
208 |
4.0 |
22.0 |
-9.3 |
|
Transport, Storage, Post and Telecommunication Services |
376 |
-6.2 |
44.6 |
5.7 |
|
Information Transmission, Computer Services and Software |
981 |
23.2 |
27.6 |
-4.4 |
|
Wholesales & Retail Trade |
7978 |
8.6 |
94.6 |
-17.8 |
|
Real Estate |
446 |
-15.9 |
346.3 |
20.2 |
|
Leasing and Business Services |
3963 |
18.0 |
124.9 |
20.5 |
|
Services to Households and Other Services |
181 |
9.0 |
7.2 |
9.3 |
Copyright 1995 - . All rights reserved. The content (including but not limited to text, photo, multimedia information, etc) published in this site belongs to China Daily Information Co (CDIC). Without written authorization from CDIC, such content shall not be republished or used in any form. Note: Browsers with 1024*768 or higher resolution are suggested for this site.
License for publishing multimedia online 0108263 Registration Number: 130349 ![]()