Heading for a double-dip?
Updated: 2011-08-15 13:20
By Daryl Guppy (China Daily)
|
|||||||||||
Four features stand out from fragile week in the markets but no global financial crisis 2
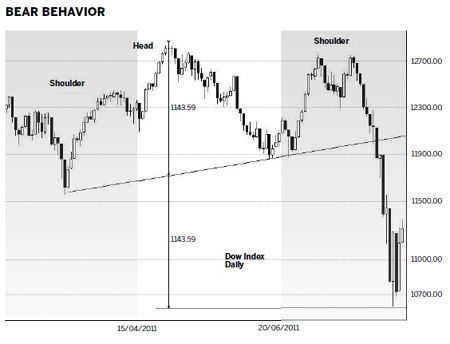
There is a problem with chart and technical analysis. Often you see the effect before you know the cause. The head-and-shoulders chart pattern in the Dow made it a high probability the market would collapse - the effect. Analysts will debate the cause of the collapse for many months. The important feature is that traders who used chart analysis were able to take action to reduce the effect of the market fall because they were forewarned as the Dow hit the targets we suggested last week.
But what a fall. What a rebound. What to make of it all? There are four important features that stand out from this fragile week in the markets.
First is the participants in this crash. They were not ordinary mum and dad small investors. The fall and rebound developed too quickly for most retail investors to participate. These market reactions were caused by a herd of elephants - the hedge funds, the institutions, the fund managers. The unprecedented volume came from these sources and they defined the volatility of the market.
Second, the fall in the Dow signals a major change in the trend and economic conditions. That's why the big money ran quickly. Rebounds and impressive dead-cat bounces will develop but the fall has revealed a structural weakness in the previous sideway trend. This is the equivalent of a market heart attack. Although you may feel better for a few minutes or days after the initial heart attack - and convince yourself that it was unimportant - the reality is that it is a massive warning of weakness.
Third, this turmoil confirms China's growing concerns about a slowdown in both Europe and the US with its consequent effect on exports and the value of the US dollar.
Fourth is the undermining confidence in the degree of sovereign risk of US debt. The Standard and Poor's decision formalized the anxiety, which has been growing for months. It requires a range of rapid policy changes. Although China will not withdraw its US debt funding there is now a high probability China and other buyers of US debt instruments will significantly scale back any future exposure and diversify to a greater extent.
This is the difference between global financial crisis 1 and the potential for a global financial crisis 2. The first was a crisis of private debt. This was solved by transferring private debt to public debt via bailouts of banks and large companies. Debt did not disappear, it was transferred. Global financial crisis 2 is about public, or sovereign, debt. Of particular concern is the growing acceptance of the idea that America should default because it is a quick remedy to its debt problem. The other remedy is to print more money - a QE3 - which will stoke the fires of inflation.
Global markets have ignored the US president's pleading about the quality of US debt after the Standard and Poor's downgrade. It is difficult to argue that Standard and Poor's analysis of European debt problems is correct, but that the same methodology cannot be applied to the US economy.
The rebound last week has the characteristics of a dead-cat bounce. This is a rally within a bear market environment. The most important use of technical analysis in these market conditions is to identify downside targets. Traders trade short as markets fall toward these targets. When the targets are achieved traders watch for consolidation patterns. The nature of these consolidation patterns determines if the bounce is a rally trade or a genuine change in the direction of the trend. These brief chart notes set the downside target levels for several major markets.
The Dow index is dominated by the head-and-shoulders trend reversal pattern. The first downside target for this pattern is near 10600. The first downside target has been achieved. Attention is now on the consolidation pattern for any rebound. The high volatility rebounds with moves of 4 percent or more are reaction rallies and retreats. They are not yet part of a consistent consolidation behavior because this usually includes a period of much lower volatility.
High volatility is not a part of consolidation. The Dow rebound in 2008 from 8200 to 9500 included high volatility. The rebound failed and the Dow dropped from the rebound high of 9500 to the long-term low of 6600. If 10600 fails as a support level then the long-term downside target is near 9700.
The UK's FTSE Index shows a long-term rounding top pattern. This is also an upward trend-reversal pattern. The depth of the pattern is measured and a downside target calculated. The first downside target near 5100 has been achieved. This is slightly above historical support near 5000. Investors look for consolidation to develop around the 5000 level. If this fails then the long-term downside support target is near 4600.
The German DAX index shows a very clear break of the upward trend with the fall below 6900. The historical support level at 6350 has been broken. The DAX developed a trading band and this is used to calculate technical downside targets. The technically calculated support target near 5700 is being tested. Failure at this level has historical support near 5100.
This is not global financial crisis 2 but these substantial trend changes have increased the potential to develop a double-dip environment.
The author is a well-known international financial technical analysis expert.
Related Stories
Chinese shares rally for third straight day 2011-08-12 17:17
European shares fall on US debt concerns 2011-07-25 16:01
- Heading for a double-dip?
- Video websites get in on the action
- Citic Securities seeks $804m from asset sale
- Bright Food to buy Manassen for $516m EV
- Quality of China's exports to EU improved in H1
- Railway passengers reach 238m during summer
- China's hurdles in the race for the future
- Dependence on imported oil warned