Knowing what to believe by studying charts
Who to believe? The market or the company accounts? It is a fundamental question about market analysis and it was highlighted in a recent report from a market regulator.
The Australian market regulator warned companies not to use "underlying profit" when they are updating the market. This calculation removes one-off or unusual company costs. The regulator wanted companies to use statutory profit calculations that did not exclude abnormal or unusual items.
The top 100 listed companies claimed in analyst briefings and media reports to have made $93 billion in underlying profits. A KPMG report found that their statutory profits were only $68 billion. Nine of the companies claiming to have made a profit actually made a loss.
This is not just a small inconvenient issue. In many ways it is an inconvenient truth about market behavior. Company financial reports are often unreliable. The collapse of MF Global revealed a mess of missing client funds, which created unexpected counter-party risk. The idea that client funds were segregated and protected has been exposed as wishful thinking. The collapse of MF Global also provided an idea of how a little bit of money can be made to go a long way using obscure words like re-hypothecation.
Hypothecation is when a borrower retains ownership of the collateral that is "hypothetically" controlled by the creditor, who has a right to seize possession if the borrower defaults. A broker may sell securities if an investor fails to keep up credit payments or if the securities drop in value and the investor fails to meet a margin call.
Re-hypothecation occurs when a bank or broker re-uses collateral posted by clients as backing for the broker's own trades and borrowings. They use client-segregated funds as collateral for their own borrowing. This process allows brokers to use clients' funds to finance proprietary company trading. Lehman Brothers, the trigger for the 2008 crash, used similar re-hypothecation methods and maintained everything was OK up until hours before the final collapse.
So here is the core of the problem for an investor. Who do you believe or, perhaps more importantly, how can you believe? Companies regularly massage reports to obscure bad news, to boost good news and to avoid paying too much tax. Some companies take a further step, manipulating figures to create a false impression.
These deceptions can continue for remarkably extended periods. Bernie Madoff was able to falsify figures for a decade or more before finally being exposed. One of America's leading companies in 2001, Enron, produced fully audited accounts that turned out to be what some called largely a work of fiction. Enron was a company subject to the full glare of publicity and, as a leading US company at the time, followed by hundreds of high-powered analysts and featured in glowing terms on the front cover of Fortune magazine. Fraud and manipulation are an inevitable part of any financial market and we cannot rely on regulators to protect us completely. Investors must also accept responsibility for their own protection.
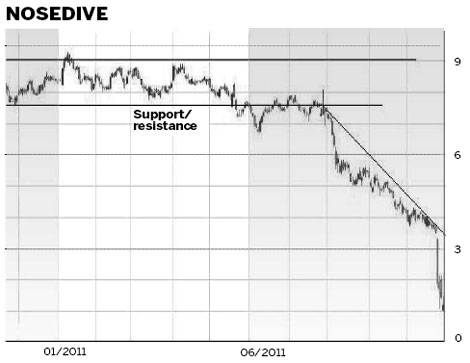
Investors with good memories will immediately see the similarity between the MF Global chart and an Enron chart from 2001. Both show a clear breakout from a sideways trading pattern. Both established clearly defined downward trends. Both companies insisted everything was fine right up until the last-minute discovery of major problems. The result is a plunge in price in the few days prior to bankruptcy and removal from the trading boards.
The detail of the problems with Enron and MF Global may be very different but the behavior of price activity is very similar. Despite the bullish analysts' calls many investors were suspicious of the reports they were receiving from each company. They chose to sell, and their selling was strong enough to create a substantial downward trend.
As an investor it is unlikely that I will know the information available to better-positioned investors who are selling. When I look at the chart of price activity with the intention of buying - usually because this is described by brokers as "a quality company available at bargain prices" - then I must ask why there is so much selling pressure? The chart activity often sends a warning of caution long before the nature of the danger is fully revealed to the market.
When company management deliberately conceals information, or is so incompetent that it doesn't understand the figures generated by its own operations, then the market often develops a divergence pattern of trending behavior - divergent because the company says everything is great but the trend moves in the opposite direction, accelerating in a downward trend.
And that's my answer to the question: who to believe? The market always wins so it pays to learn how to listen to the market rather than the distractions of sometimes illusory profit figures from company management and reports.
The author is a well-known international financial technical analysis expert.
(China Daily 12/19/2011 page14)