Liquidity move provided a relief rally, not a trend
The coordinated action by five central banks - the United States Federal Reserve, Canada, England, Japan and Switzerland - was designed to provide liquidity and support for the euro. Some feared the euro would collapse in a matter of weeks if action were not taken quickly. The coordinated announcement before the opening of US trading on Dec 1 provided a lift for US markets and this flowed through to regional markets.
This is a relief rally. It is a relief that strong action has been taken to assist the problems in the eurozone. This action does not solve the problems, but it pushes away the time when the problems will again become very serious.

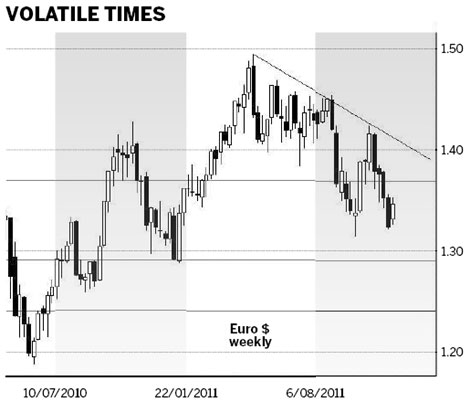
The chart behavior of the euro dollar weekly shows the conditions that are necessary to restore full confidence in the euro. The euro developed a small rally. The US Dollar Index, used as a measure of US dollar strength, fell from $0.793 to $0.78. When US dollar weakness develops it is usually a signal for a rise in the price of gold. The price of gold rose from $1,692 to $1,760.
The key question is to decide whether this coordinated bank action is a genuine long lasting solution or just a temporary short-term fix that has delayed the inevitable. Eurozone uncertainty about the euro is reflected in the volatility of the euro dollar chart. It is useful to step back from the volatility of daily trading and look at the bigger picture using a weekly chart. This helps to put the daily price activity into a broader context. The picture may remain confused and chaotic but there is usually a broader perspective of the context of the daily price activity.
The most important feature in the euro dollar chart is the downward sloping trend line starting from the May high at $1.49. The failure of the rally in September and again in October provided the three anchor points to confirm the position of this downward trend line.
This has three effects.
First, it helps to establish the trend and provides the limits for potential rallies in the future.
Second, the three anchor points define a strong and established trend.
Third, the line is used to tell traders when the downward trend has ended and a new upward trend has commenced. A close above the downward trend line is significant because the downward trend line has been confirmed with three anchor points.
The area near $1.37 has provided support and resistance starting in 2007. Sometimes this has been strong, and at other times the market has moved quickly below or above this level. This $1.37 level is a reference level. The current relief rally can move quickly to $1.37. The strong resistance level is created by the downward trend line and the current value is near $1.39. There is a low probability the $1.39 level will be broken. This suggests that the secular, or long-term trend, remains down despite the relief rally.
The general trend direction is down so the next question is to determine potential downside limits. These limits, or downside targets, are provided by the historical support and resistance levels. The level near $1.37 is weak and has already been broken twice on the downside. The stronger support level is near $1.29. This is the upper edge of a broad consolidation band that stretches between $1.24 and $1.29.
The continued reaction retreats away from the downward trend line suggest a steady move toward testing support near $1.29. This is the initial downside target for the relief rally retreat.
Within these upper and lower limits the volatility of the trend behaviors remains high with very fast rallies and retreats. Traders need to move quickly between long and short positions as rallies develop and collapse quickly. Even though the broad trend is down, it requires good agility to remain profitable in this type of market. It provides significant challenges to traders who are hedging currency exposure.
The volatility inside this trend behavior means changes of $0.10 can develop within two to three weeks. Rebound rallies of $0.10 can develop just as quickly. Getting the direction of the trend is the first step. Trading the volatility within that trend direction is the second step and it is much more difficult.
Traders look first for stabilization of the downward trend with strong support near $1.29, or consolidation support between $1.24 and $1.29. Until there is a weekly close above the value of the downward trend line then every rise is treated as a rally rather than a trend change.
Euro strength suggests US dollar weakness and the potential for the dollar index to retest $0.75. These have the behavior of relief rallies rather than a genuine change in the trend.
The author is a well-known international financial technical analysis expert.
(China Daily 12/05/2011 page14)