Discomfort with dollar is measured in gold
|
One-thousand-gram gold bars. Gold has become the leading fear gauge while the US Dollar Index and the euro nervously await more bad news. Kerem Uzel / Bloomberg |

Buy gold and avoid paper money, or fiat currencies, seems to be the message from markets in response to the unsurprising downgrade of US debt by ratings agency Standard and Poor's. Gold peaked at a new high of $1,881 an ounce in a fast-moving rising trend. The reaction in the currency markets has been more subdued. Gold has become the leading fear gauge while the US Dollar Index and the euro nervously wait for more bad news.
There is a significant change in the trend for gold that suggests further currency weakness in the US dollar and the euro. Starting in July 2010, the rise in gold was defined with an uptrend line. This line acted as a support level until January 2011. The move below the trend line indicated a change in the nature of the gold trend. From January of this year until August, the long term uptrend line acted as a resistance level. This function changed in the last week.
Gold moved above the trend line on August 9. After peaking at $1,817, gold retreated and the long-term uptrend line acted as a support line. The gold price rebounded from the value of the trend line. This indicates a resumption of the long-term uptrend for gold.
Using the same price projection methods that identified price targets at $1,640 and $1,740 we set a new price target near $1,837. A move above this level has a new target near $1,935. Any retreat from this target now has a higher probability of using the uptrend line as a support level. Investors are buying gold and betting the dollar will weaken further, particularly if the United States policy moves towards a third round of quantitative easing and the nation prints more money.
In June, the US Dollar Index had the potential to rebound and become stronger. The slow resolution of the US debt problem and the growing problems in Europe have made the currency situation more confused. The currency markets are not reacting as strongly as the activity in the gold price would suggest.
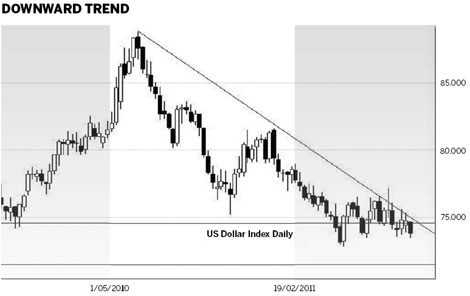
The US Dollar Index is a basket of currencies. They are the euro, Japanese yen, British pound, Canadian dollar, Swiss franc and Swedish krona. The Dollar Index is used as a measure of the strength or weakness of the US dollar.
The US Dollar Index chart has not developed a downtrend breakout. The downtrend is defined with a trend line. This downtrend line starts in June 2010 near $0.888. The line touches the high of $0.795 in January. The third point for the trend line is the high in early July at $0.766. The weekly candle chart shows several highs above the downtrend line, but every week the index has closed below the downtrend line. The closing price is significant because it is considered to be set by the professionals in the market.
A short-term uptrend line starts in May this year from the low at $0.728. The uptrend line uses the low of $0.735 in June. The third point for the uptrend line is at $0.744 in July.
The US Dollar Index weekly chart has closed below the trend line. This suggests a continuation of downtrend weakness in the dollar. The counterbalancing rise in the gold price confirms this downward pressure. The first downside target for the Dollar Index is near $0.715. Failure of support near $0.715 has a lower downside target near $0.695.
This lower target is enhanced by the recent announcement that the US Federal Reserve will keep interest rates low into 2013. There is no expectation of an increase in yield from the dollar and this increases downside pressure. A weak dollar provides a devaluation boost for US exports. The downtrend in the US Dollar Index is broken only when the weekly candle chart is able to close above the value of the downtrend line.
Other currency markets, including the euro, will follow the lead set by the US Dollar Index. This is despite the fact that the distressed euro makes up a major component of the US Dollar Index.
The Euro/USDollar weekly chart shows an equilateral triangle pattern. This is a broad chart pattern and it does not have a well defined base so it cannot be used to calculate accurate price projection targets. The base of an equilateral triangle pattern on a weekly chart is created by 2 to 6 weeks in price activity that moves in a single direction. This has not developed with the Euro/USDollar chart so it is not an exact equilateral triangle pattern.
The equilateral triangle pattern confirms market indecision. Usually a breakout moves very quickly and with the Euro/USDollar this is a quick move towards historical support or resistance levels. An upside breakout has a first resistance target near $1.49. A downside breakout has the first support target near $1.36.
Investors are watching for more weakness in the US Dollar Index and paradoxically this may lead to more strength in the Euro/USDollar. With fiat currencies in a confused state, the upward pressure on gold continues.
The author is a well-known international financial technical analysis expert.
(China Daily 08/22/2011 page14)