Dow index starts to look bullish

A few months ago there was a significant concern that the Dow index was developing a head and shoulder chart reversal pattern. The danger was in the similarity between this pattern of development and the patterns seen in the US market following the 1930 collapse. This modern head and shoulder pattern was invalidated when the Dow closed above 11700. The rebound rally above this level has continued for nearly five weeks.
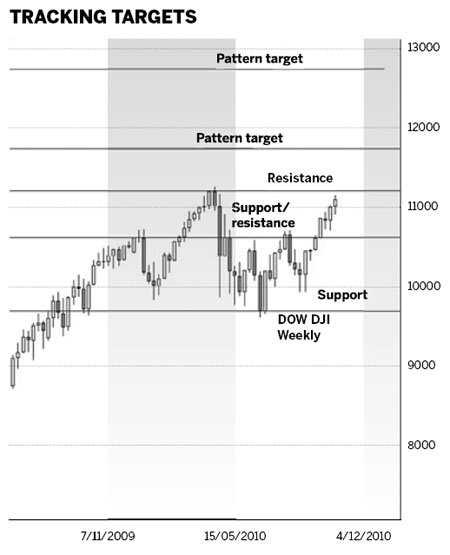
The pattern of support and resistance, and the broad pattern of trading band behavior, provides some calculation points for projecting future targets for the Dow. The outlook is more bullish than it has been in recent months. The potential for a sharp temporary retreat during October remains a strong probability based on historical behavior.
The consolidation pattern starts with support near 9700. There was strong historical support in this area in 2003 and 2004. It provided support for the low points of the Dow retreat in July 2010. In 2010 the index also found support slightly higher near 9800. For calculation purposes we use 9700 in the middle of this small 2010 support band. Charting analysis does not always provide convenient, exact figures.
The upper level of this broad trading band is near 11200. It is used with caution because this resistance level has not been completely tested. It is based on the Dow highs in May 2010. The recent market reaction away from this level helps to confirm its importance as a psychological resistance level.
The strongest and most consistent support/resistance level is near 10600. This is the most important feature on the Dow chart. The move above 10000 captured public imagination, but it is 10600 that has most consistently acted as a support or resistance level. This was the resistance point that developed the potential right shoulder in the head and shoulder pattern. It's the move above 10600 in the last four weeks that confirms developing trend strength.
This pattern of support and resistance provides a method to calculate a short-term target for the Dow and a longer-term target. These are targets achievable with a breakout above 11200.
The short-term target is near 11700. It is calculated by measuring the distance between the 10600 support resistance level and the upper edge of the trading band.
The long-term target is near 12700. This is calculated by measuring the full width of the trading band between 9700 and 11200. This value is thus projected upwards.
Breakouts from these types of consolidation patterns have developed in several markets. The breakout from the consolidation pattern in the Shanghai index rapidly achieved the first target of 2780. It continued to quickly move toward the longer-term target near 2880. The behavior of the India market shows the same type of consolidation breakout pattern that is seen with the Dow. The India breakout has moved more quickly, achieving the first and second calculated targets.
Breakouts from consolidation patterns are often very powerful, although they take many weeks or months to develop. This confirms the potential for the first and second Dow targets to be achieved.
The second factor is to assess the projected targets against historical behavior. The first target near 11750 also acted as a resistance level in August 2008 and earlier in 2006. The upper target level near 12700 acted as resistance and support level in March 2008 and also early in 2007.
When chart pattern calculation areas generate targets that matched with historical support and resistance behavior then it helps to verify the calculations. It increases the probability these targets will be achieved and that they will act as pause points in the trend development.
The immediate task for the Dow is a breakout above 11200. Failure to break above this level suggests a retest of support at the strong 10600 level. Continued oscillation between 10600 and 11200 is bullish behavior and points the way to a successful breakout above 11200.
The author is a well-known international financial technical analysis expert.
(China Daily 10/18/2010 page14)