Top Biz News
Copper markets show strength and stability
By Daryl Guppy (China Daily)
Updated: 2010-01-04 08:05
 |
Large Medium Small |
Commodity demand is a measure of the strength of economic development. It is a leading indicator because it shows anticipated demand. Every new apartment building and office block requires kilometers of copper wire. Copper is one of the foundation metals of modern economic development.

Copper is one of two benchmarks for the hard commodities. The first benchmark is the price of oil, which we considered last week. The second benchmark is set by the copper price as traded on the London Metals Exchange (LME) or the New York Metals Exchange (NYMEX). The behavior of the LME price is slightly different from the behavior of price on the Shanghai Futures Exchange.
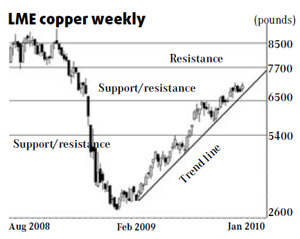
The LME weekly copper price chart shows a powerful V-shaped recovery from Dec 2008. The new uptrend is defined by a single line starting from the low in Feb 2009. There are three key patterns in the copper market.
The first is the reliability of the trend. This is a steady trend that successfully tested the uptrend line. Prices have moved down to the line and then rebounded. This shows the line successfully identifies the support levels for this trend. It suggests a low probability the trend will change.
The very fast rise in the price of copper between June 2005 and May 2006 showed a different, parabolic trend. It was unsustainable, so the rapid price collapse that ended in Feb 2007 was not a surprise. The current trend in 2009 is more stable and suggests higher prices in 2010 and a low probability of a sudden collapse in price.
The second trend is the relatively low level of speculative bubbles. The price develops rallies, but these are followed by consolidation periods. The price moves sideways until it reaches the trend line and then it rebounds. This confirms strong trend stability.
The third feature is the continued influence of historical support and resistance levels. The market developed resistance near 5,400 pounds ($8,681.82) and again near 6,500 pounds. These are historical levels. This behavior suggests the trend will continue to develop consolidation behavior near the historical support and resistance levels.
The next historical resistance level is near 7,700 pounds and this is the first bullish target for 2010. The second 2010 target is near 8,500 pounds. A price retreat below the current uptrend line has good support near 6,600 pounds.
| ||||


There is one important difference in the market behavior -- the location of the support and resistance behavior. There is strong historical support near 51,800 yuan ($7.586.19). The next strong historical resistance level is near 69,500 yuan.
The Western copper markets are moving towards a strong resistance level that is near the current price. The Shanghai market is moving towards a weak resistance level. The strong historical resistance level is much higher and located near 69,500 yuan. This suggests a higher probability of strong trend continuation for 2010 and a small price consolidation near 61,300 yuan. The Shanghai Futures copper chart is very bullish. Any retreat from the current price level has good support near 51,800 yuan. All copper markets show strong and stable trend behavior.
The author is a well-known international financial technical analysis expert and is known as "The Chart Man".