


We have launched E-mail Alert service,subscribers can receive the latest catalogues free of charge

Prospects for China's Air Pollution Control: Problems and Policy Options
2015-08-18


Chen Jianpeng & Li Zuojun
In recent years, the haze weather occurring in most places of China has drawn extensive public attention, becoming a hot environmental issue for the present time. With the rapid development of urbanization and industrialization in China, the types of air pollution have changed significantly. The long~lasting problems, such as SO2, TSP/PM10, remain unsolved, and discharges of PM2.5, NOX and VOCs have increased evidently, thus worsening the air pollution.
I. Prospects for China's Air Pollution Control
1. Progress has been made in controlling conventional air pollutants and indicators of urban air quality monitored routinely take a turn for the better
(1) The rise of SO2 discharges has been basically held in check
During 2001~2011, the increase of SO2 in exhaust gases discharged nationwide was followed by a decrease. During the 10th Five-Year Plan period, the total of SO2 discharged increased steadily from 19.478 million tons in 2001 to 25.888 million tons in 2005, leaving the emission reduction targets set for the 10th Five-Year Plan unfulfilled. During the 11th Five-Year Plan period, China began to exercise volume control over SO2 discharges and advanced the thermal~power desulfurization work in an all~round way. SO2 volume in waste gasses in industrial waste gasses and in domestic waste gases discharged nationwide all dropped on a yearly basis. In 2010, the amount of SO2 discharged nationwide decreased by 14.3% as compared to 2005, an overfulfillment of the emission reduction task set for the 11th Five-Year Plan . In 2011, SO2 was discharged to a total of 22.179 million tons, down 2.21% as compared with 2010.
(2) Smoke and dust discharges have been brought under effective control
During 2001~2010, the amount of industrial dust dropped steadily from 9.906 million tons in 2001 to 4.487 million tons in 2010. During 2001~2010, smoke discharges increased gradually and then decreased steadily. Of the years, between 2001~2005, the amount of smoke discharges increased from 10.698 million tons in 2001 to 11.825 million tons in 2005. Later, the amount of dust discharges decreased year by year from 10.888 million tons in 2006 to 8.291 million tons in 2010.
(3) Indicators of urban air quality monitored routinely take a turn for the better
Sulfur dioxide, nitrogen dioxide and inhalable particles are (current) indicators monitored regularly in urban areas of China. Data show that, since 2005, the annual average concentration of major air pollutants in China's urban ambient air, such as SO2, NO2, PM10, has shown a continuous downward trend, with the concentration exceeding the standards in some cities. However, the national annual average has been lower than the Grade~II Annual Average Limit of the present environmental quality standards. During the 11th Five-Year Plan period, the soot~caused air pollution was being initially held in check in China.
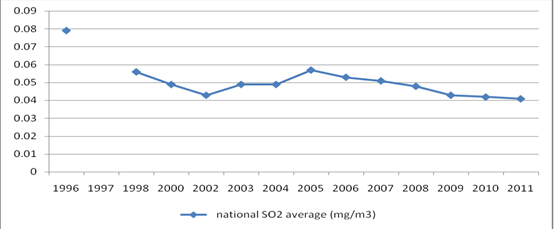
SO2 concentration has reduced. Data show that SO2 concentration has assumed a downward trend since 2005 in key cities of China (Figure 1). In 2011, the number of cities at the prefectural level or above where annual average SO2 concentration reached the standard accounted for 96% of all the cities nationwide3.
|
1980~1990 |
1990~2000 |
2000 up to now |
|
|
Primary pollution sources |
Coal, industry |
Coal, industry and dust |
Coal, industry, motor vehicle and dust |
|
Major pollutants |
SO2, TSP,PM10 |
SO2, NOX,TSP,PM10 |
SO2, PM10, PM2.5 NOX, VOCs, NH3 |
|
Main air problems |
soot |
Soot, acid rain, particles |
Soft coal, acid rain, photochemical pollution, dust~haze/ Fine particles, hazardous and noxious substances |
|
Air pollution measurement |
locality |
Locality + region |
Region + hemisphere |
(2) Regional haze weather is becoming increasingly severe
Studies show that there were fewer smoggy days in China during 1950~1980, but after 1980 the number of smoggy days increased evidently and rose drastically after 2000 and that, the annual average of smoggy days in 2010 (29.8 days) was almost 4 times that of 1971 (6.7 days) In recent years, the number of haze~polluted days occurring every year in Beijing~Tianjin~Hebei Area, the Yangtze River Delta Area and the Pearl River Delta Area has reached 100 or more, while haze pollution has been even worse in such cities as Guangzhou, Nanjing, Hangzhou, Shenzhen and Dongguan.
…
If you need the full text, please leave a message on the website.
1Total amount of SO2 discharge targets dropped by 10% during the 11th Five-Year Plan period.
2The 2011 data come from China Environmental Bulletin, 2011 published by the Ministry of Environmental Protection, with the scope of statistics adjusted in 2011.
3Source: China Environmental Quality Report, 2011, Ministry of Environmental Protection, December 2012.
4Source: China Environmental Quality Report, 2011, Ministry of Environmental Protection, December 2012.
5Source: China Environmental Quality Report, 2011, Ministry of Environmental Protection, December 2012.
6Yan Li and et al: "An Analysis of the Trains of Thought for Preventing and Controlling Particulate Pollution During the 12th Five-Year Plan Period", China Environmental Policy (9th Volume), China Environmental Science Press, pp. 49-63, 1st Edition of October 2012.