-
News >Bizchina

Metal prices suggest upturn
2011-07-11 13:11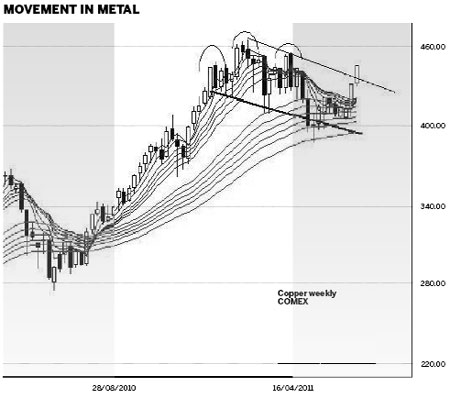
Rise in copper cost used as leading economic indicator, reacting fast to industry demand
Economic forecasting often brings together a collection of statistical measures. This includes the purchasing managers index, non-farm payrolls in the United States and other reports. They are compiled from taxation of regulatory reports to government departments. They take time to compile and there is often disagreement about the importance of some of the reports.The price behavior in markets is very sensitive to changes in these economic conditions. The market moves before the statistics are compiled and the formal economic reports are analyzed. Often these reports are used to validate the activity already shown in market indexes, or in commodity price behavior.
 The movement in the copper price is often used as a leading indicator of economic development because it reacts more quickly to changes, and anticipated changes, in industrial demand. This behavior has been distorted in recent months by the activity of investment speculators, particularly those funds, which have hoarded copper in response to investor demand.
 Several other industrial metals also react quickly to changes in demand, and these includes tin and nickel. Tin is used in many manufacturing processes. Nickel is an additive to more advanced metal production and manufacture.
Rising prices in industrial metals futures are a leading indicator of an increase in economic activity. The recent price rise in COMEX copper is a leading indicator of this change.
In April the COMEX copper price activity developed a small head-and-shoulder pattern. This is usually an upward trend-reversal pattern. This small pattern suggested a retreat in the copper price, but not a significant change in the trend. The downside target for this pattern was near $370. The pattern failed to develop fully and the price fell to a low of $387 before rebounding. The pattern downside target was not achieved. The head-and-shoulder reversal pattern fails to desktop in around 20 percent of examples.
The copper price developed a rebound and a small consolidation with resistance near $420. The last two weeks have seen a powerful rally above the $420 resistance level. This is also a break above the short-term downward trend line. This signals a continuation of the upward trend. It also signals a resurgence of economic growth.
The failure of the head-and-shoulder pattern is confirmed with a price move above $450. This is the value of the high of the right shoulder of the pattern.
The strength of the long-term upward trend is confirmed with the behavior of the long-term group of averages in the Guppy Multiple Moving Average (GMMA) indicator. This indicator tracks the behavior of investors and traders. The long term GMMA did not compress significantly when the copper price fell from $460 to $387. This indicated that investors were buyers in the market. They used the weakness in the copper price as an opportunity to buy more contracts at favorable prices because they believed the long-term price would be higher. .
If the long-term GMMA had developed significant compression it would show investors had become sellers, and this would have contributed to a stronger downward trend development.
The initial upside resistance target for copper is near the previous high at $460. Currently there is no price or chart pattern development that allows for the calculation of the upside target above $460. The small support resistance level near $420 provides a limited guide to the breakout above $460. This suggests an upside target near $500. This is calculated by using the width of the narrow consolidation band between $420 and $460. The $500 target is used as a guide. It is confirmed with the development of new price activity as the market moves toward $460.
This same style of trend breakout pressure is also seen with the nickel price traded on the London Metals Exchange. This is a strong breakout from the downward trend and has a resistance target near $25,000 a ton, up from the current $23,500 level.
The tin price traded on the London Metals Exchange is in the early development stages of a parabolic upward trend with an initial target around $30,000 a ton, up from the current $27,500 level.
The upward pressure in these associated industrial metals gives an early indication of a stronger global economic recovery but these charts do not provide an indication of the location of the recovery.
The author is a well-known international financial technical analysis expert.