Top Biz News
Going cup in hand to the Shanghai market
(China Daily)
Updated: 2010-02-08 11:03
 |
Large Medium Small |

Chart patterns sometimes fail and when they do it is important to adjust analysis to recognize the new situation. The long term cup and handle pattern in the Shanghai Index signaled failure in the last week.
The failure is created by the degree of the retreat from the upper edge of the cup pattern. The cup and handle chart pattern is most clearly seen on the weekly chart because it consolidates the clutter of daily price activity and gives a strategic perspective.
The perfect cup and handle pattern starts with a series of lows that are captured with a curved half circle trend line. It is a retreat and recovery pattern. The upper starting and ending points of the pattern define the lip of the cup. Many of these cup patterns go onto develop a handle. The handle is created by a price retreat from the upper right hand point of the cup pattern. The cup and handle pattern in the Shanghai Index weekly chart is not perfect but it largely follows the pattern. A fall of more than 50 percent in the Shanghai index cup and handle pattern is signaled by the move below the 3,000 level.
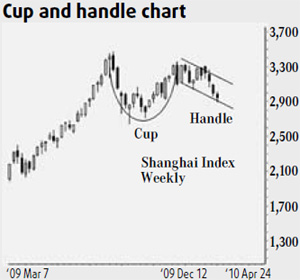
The cup and handle pattern reflect the behavior of investors. The left side of the cup shows investors are increasingly nervous. There is a steady sell-off followed by a slowing of selling pressure. This is exhibited as a curved trend line. The curved trend line turns upwards and reflects increasing investor confidence that the sell-off has finished. Investors bid carefully for stocks they believe have been oversold. Their enthusiasm increases as they worry they have missed the opportunity for a good entry at cheaper prices. The result is the second half of the trend line curve which slopes upwards.
The curving trend lines show a market that is not too excited and becoming quietly confident about the future.
The handle is created first when short term investors start selling to capture profits. These are often traders who bought near the bottom of the cup and they are happy to take a small profit. Their selling begins to worry other investors and they also join the selling. The nature of the price fall is important. A rapid price fall shows the market has changed the trend. A price fall that develops a parallel upper and lower trend line shows a market that is cautious. These are investors taking short-term profits.
The cup and handle pattern is successful when new investors start buying and push the price above the upper edge of the handle pattern. This often develops into a very rapid price breakout and a fast upward move.
The cup and handle pattern is unsuccessful when the price activity retreats by more than 50 percent of the height of the cup pattern. This may develop into a longer-term downtrend. Investors become increasingly concerned and the price can quickly fall to the nearest support level. In the last week the Shanghai Index has moved below the 3,000 level and signals a higher probability the cup and handle pattern has failed.
| ||||


There is a higher probability that the market will continue to move towards the longer-term historical support area near 2,650 to 2,700. In this situation investors will look for consolidation behavior and evidence of a sustainable trend rebound. There is a 75 percent probability the market will rebound into the year of the Tiger in the month following the Spring Festival holiday.
The author is CEO of Guppytraders.com, Darwin, Singapore, Beijing