Opinion
Mid-2009 uptrend momentum slowing down
By Daryl Guppy (China Daily)
Updated: 2010-01-25 08:02
 |
Large Medium Small |

The Shanghai Index retreat was first triggered by the announcement of a lending suspension applied to some banks. The down pressure increased when global markets fell dramatically after the US president announced an unexpectedly severe attack on Wall Street and American banks. His proposed measures will destroy the profits of many banks in a financial system that is already weakened by the global financial crisis. The DOW fell further as the full impact of these proposed measures were assessed. Many people worry that this will slow down any American economic recovery.
These news announcements overshadowed China's move up the global economic ladder to become the largest manufacturer in the world, ahead of the US. China also became the second largest economy in the world, overtaking Japan. China is now the second largest destination for direct foreign investment. Despite this bullish news, the Shanghai market turned bearish.
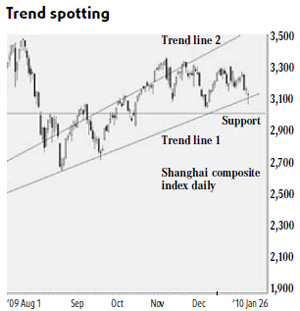
The rapid uptrend growth momentum starting in the middle of 2009 has already slowed. The Shanghai Index developed a trend correction using price in November 2009. This changed into a trend correction using time as the market developed a broad sideways trading pattern. The sideways pattern shows a trend pause. It does not show an uptrend reversal.
Any major uptrend reversal is most often preceded by the development of end-of-uptrend patterns. The most common of these are a rounding top, a head and shoulder pattern, a blow-off top or a down sloping triangle pattern. None of these patterns have developed with the Shanghai Index. The absence of these patterns reduces the probability of a sustained downtrend developing. However, caution is required.
The fall in the Shanghai Index has shifted attention away from the strength of resistance near 3,400. The strength of resistance near 3,300 to 3,400 has been very strong. Understanding the location of support areas and evaluating the strength of support has become more important with the market retreat.
This support analysis is critical for two reasons. The first reason is the way support provides a rebound point for a continuation of the trend. The second reason is the way the support areas provide a signal that the current uptrend has ended and a new downtrend may develop. This signal comes when the index moves below the support area.
There are two support features in the Shanghai Index. The first is the longer-term uptrend line 1 with a current value near 3,100.
The position of the longer-term trend line 1 is not exact and it may be adjusted to include new index activity when a rebound develops. The market dipped below the trend line 1 on Friday but closed above the trend line. If the rebound continues then the position of the long-term trend line may be adjusted. The trend line is an important feature because it defines the continuation of the uptrend. A rebound from this support level allows the index to make another attempt to break out above the strong resistance area between 3,300 and 3,350. A rebound from the longer term uptrend line is bullish.
The second feature is the well-defined historical support level near 3,000. This is a narrow support band area. The lower edge of the band is near 2,960 and the upper edge is near 3,010. A fall below the longer-term uptrend line will find support in the 3,000 area. The market reaction in this support area is critical for the development of the market.
A rebound from this 3,000 support area is mildly bullish. It shows continued uptrend strength but it signals a change in the nature of the trend. A successful test of support near 3,000 increases the probability the market will develop a sideways trading pattern. This shows the development of a trading band with support near 3,000 and resistance near 3,400. In this market condition the longer-term up trend line 1 would also act as a new resistance level.


A sustained fall below the 3,000 support area is bearish. The strongest support area is between 2,650 and 2,700. This area has been an historical support and resistance area in 2007, 2008 and 2009. If this fall developed it would signal a significant change in the nature of market activity because it creates a wider trading band.
The market was experiencing resistance near 3,400. The market has been absorbing the announced measures to manage economic growth. This has created some downwards pressure. The unexpected attack on the American financial system and the global consequences have increased the downwards pressure so investors focus on the ability of support areas to hold.
The author is a well-known international financial technical analysis expert and is known as "The Chart Man".