Shanghai index 'set for greater losses'
Updated: 2012-01-16 10:00
By Daryl Guppy (China Daily)
|
|||||||||
|
|

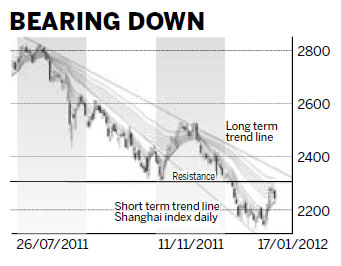
There are five key features in the behavior of the Shanghai index. These features provide the environment for the development of a downward trend breakout for the index. The features are the support activity created by the short-term trend line; the resistance activity created by the long-term trend line; the historical support/resistance feature near 2300; the historical support near 2000, and the wide separation in the Guppy Multiple Moving Averages (GMMA).
The short-term trend line starts with the high near 2820 on July 18. This downward trend line acted as a resistance level until Oct 26. The breakout above the value of short-term trend line signaled the start of the 2011 rally from October to November. Now the short-term trend line acts as a support level.
The long-term trend line starts from the high near 3070 on April 18 last year. It uses the high of 2820 on July 18 and the high near 2530 on Nov 14 as the location points for the downward trend line. This is the long-term downward trend line and it acts as a resistance level. A breakout above the value of this downward trend line is very bullish. Current value is near 2340.
The current rally is testing the support/resistance level near 2300. A move above this level is bullish. A retreat away from this level is bearish and confirms the downward trend remains very strong.
The strong historical support level is near 2000. The market may develop a consolidation band between 2000 and 2300. Activity inside this trading band could contain high volatility with very fast rallies and very fast retreats. This is the danger in the current market with the potential for a rapid retreat from resistance near 2300 and a retest of support near 2000 to 2150.
The long term GMMA shows investors' thinking, and this remains well separated. This suggests investors are sellers in this market and their selling will help create the retreat from the 2300 resistance level. The most important future behavior development is compression in the long term GMMA because this shows investors are becoming buyers. This is a bullish behavior and it will confirm the development of a new upward trend.
Market rebounds may develop in several types of patterns. They are firstly L-shaped consolidation. This pattern develops when the index stops falling and then moves between well-defined support and resistance levels. This pattern may develop between the long-term historical support level near 1700 and the support level near 2000. The strong rally toward 2300 already suggests this L-shape consolidation pattern will not develop.
Next is the saucer pattern. This distribution pattern is created as investors sell their stock. The gradual reduction in the selling pressure develops a falling curve. The distribution pattern is followed by an accumulation pattern when new investors begin to buy more stock. The accumulation pattern forms the right side of the saucer pattern with a rising curve. The shape of the complete pattern is defined using a single curved trend line and this looks like a saucer. This pattern often takes two to six months to fully develop. Third is the V-shape recovery. The strong resistance features near 2300 and the value of the long-term trend line suggest the Shanghai index will retreat. A small retreat is bullish because it is easier to retest the resistance levels.
The author is a well-known international financial technical analysis expert.
Related Stories
What is the Shanghai Composite Index 2010-07-29 16:05
Shanghai launches prosperity index 2011-04-02 09:15
Shanghai to launch insurance index 2001-12-13 10:49
Shanghai index sets record 2007-05-09 09:08
- CEO: 'Golden Year of the Dragon' for BMW
- China slashes US sanction on Chinese firm
- Q4 GDP growth expected to drop below 9%
- Beijing home prices drop 11.3% in 2011
- Saudi oil refinery deal shows close ties
- Olympic venues face financial woes
- Shoemakers head home for profits
- Having bottle to invest in red wine