InfoGraphic
Charting the ebb and flow of human emotion
By Daryl Guppy (China Daily)
Updated: 2010-05-04 09:52
 |
Large Medium Small |
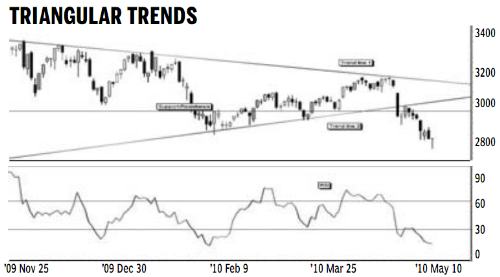
Triangle chart patterns are created by the combination of trend lines and support or resistance levels. The duration of the triangle is divided into thirds. The most powerful breakouts from the triangle pattern come from the middle third of the triangle pattern. These powerful breakouts have a high probability of achieving and exceeding the triangle target projection level.
A breakout from the final third of the triangle is often weaker and there is a lower probability of the breakout reaching the pattern target projection levels. The current breakout has developed in the final third section of the triangle from March 2010 to June 2010.
This weaker breakout increases the influence of the nearby support areas. The technical downside target for the triangle pattern is near 2200. This is calculated by measuring the height of the base of the triangle. This value is projected downwards from the point where the breakout developed.
The technical downside target near 2200 is a low probability target because of the strength of the support levels at 2900, 2700 and 2400. A falling market has to move through each of these support levels before reaching the final target. These support levels slow the speed of the fall.
Traders and investors are watching the market retreat and they are waiting evidence of a rebound and the development of a new uptrend. The evidence of a rebound starts as the Shanghai index moves toward the support areas. The evidence is also found in the behavior of the RSI. The key behavior is the development of an RSI divergence.
|
||||


There are two potential divergence patterns. The lows in the Shanghai Index already have a downward trend. The RSI divergence can develop as a double bottom rebound in the RSI.
In this situation the RSI trend between the valley lows is horizontal. The strongest RSI divergence develops when the RSI trend line slopes upwards and moves in the opposite direction to the trend line on the index chart. Traders watch for this situation to develop and use this as a leading indicator of a market rebound and reversal.
The author is a well-known financial technical analyst