Top Biz News
Asia 'top' shows market rally is at an end
(China Daily)
Updated: 2010-02-02 08:06
 |
Large Medium Small |
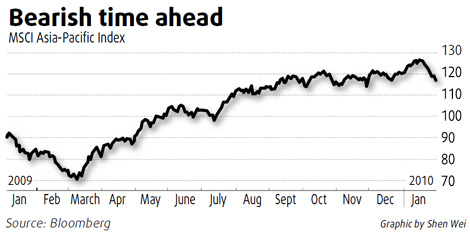
SINGAPORE: Asian stocks may decline for months after forming a "top" that signals the end of a 10-month rally, according to Elliott Wave International Inc.
Benchmark indexes across the region have completed either three- or five-wave patterns showing that their gains are over, the researcher said in its February Asian-Pacific Financial Forecast report.
The rally's duration and the divergence in both momentum and sentiment also signal a downturn, it said.
The MSCI Asia-Pacific Index has lost 7.9 percent since Jan 15, when it peaked 80 percent above the March 9 low.
The advance, spurred by signs of a recovery in the global economy and corporate earnings, coincided with a March prediction by Elliott Wave International that a "massive rally could ensue in the near future".
"With the MSCI Asia-Pacific Index having just broken below an important uptrend line, we have reached March 2009's polar opposite juncture: the end of the rally," Elliott Wave International said. "It's time to turn bearish."
The Elliott Wave Theory, created by US market analyst Ralph Elliott in 1938, attempts to predict future price moves by dividing past trends into sections, or waves, and calculating changes in value.
Hong Kong's Hang Seng Index, Singapore's Straits Times Index, the Shanghai Composite Index and the Nikkei 225 Stock Average of Japan completed three-wave cycles, the Gainesville, Georgia-based research company wrote.
| ||||


The 311 days it took to reach last month's high from the March low is 62.8 percent of the index's 495-day decline between 2007 and 2009, Elliott Wave International said. That's just five days more than the time taken for a 61.8 percent Fibonacci retracement.
Meanwhile, the index's relative strength index, an indicator of momentum, peaked in January at a lower level than that set earlier in the rally, while the Nikkei 225 Daily Sentiment Index also reached a high that was lower than previous levels seen during the advance, the researcher said.
"Excessive bullishness is in fact bearish from a contrarian perspective, and sentiment divergences, like momentum divergences, are common at tops," according to the report.
Bloomberg News