Top Biz News
Changing market dynamics open up new vistas
By Daryl Guppy (Chinadaily)
Updated: 2009-11-10 11:19
The behavior of financial markets is often correlated, which is why Western investors look to the Dow Jones Index for leadership. When the Dow rises, the rest of the world follows. When the Dow falls, traders prepare for falls in their own markets. This strong correlated behavior was clearly seen in 2007 and in the first part of 2008. Then something unusual developed. The basis of international market correlation changed.
In every market, investors try to identify key trend turning points in the trend. The Dow market peak in November 2007 is the key turning point for the American market collapse in 2008. The lows created in March 2009 are the key turning point for the new uptrend rally experienced in the American market and followed in European and Asian markets. For many market analysts, this is the normal situation and they believe the Dow leads and the rest of the world follows.
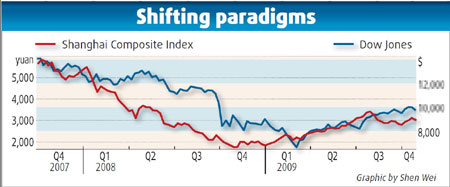
China market behavior is different. The peak in the Shanghai index was in October 2007 and the market developed a dramatic decline. This market fall continued until November 2008. The market developed a consolidation pattern and then developed a new uptrend. The degree of fall was much greater than the market fall in the United States. This confirmed the different relative volatility between the two markets.
However, the global situation has changed as the balance of economic and market power has shifted. Global financial market leadership has shifted from the United States to China. This is not a transfer of economic power, but it is a transfer of market behavior. China leads market behavior and America follows. The chart of the Dow and the Shanghai Index shows the key to the change in the relationship.
First, we create a chart of the Shanghai index with the market peak in October 2007 and the market low in November 2008. Then take a chart of the Dow Index and shift it backwards in time so the March 2009 market low in the Dow Index is placed above the November 2008 low in the Shanghai Index. This is a time-shifted chart display and it reveals an important change in market relationships.
The correlation in the behavior of the two markets is almost exact. When the Shanghai Index develops a rally, the Dow develops a rally. When the Shanghai Index falls, the Dow also falls. This would be an interesting coincidence except that this correlated behavior has been in place for almost two years since late 2007. The chart display is time-shifted so it shows the Shanghai index leads the behavior of the Dow index by around three to four months.
| ||||


After the price correction, the Shanghai Index moved sideways for two months before developing the current strong uptrend breakout. This suggests an 8- to 10-week sideways consolidation period in the Dow followed by an uptrend breakout. Understanding this new market correlation provides an investing advantage and gives investors the courage to add to investments.
Investors who want to understand the Dow need to look first at the Shanghai Index. The rest of the world may follow the Dow, but smart investors know the Dow is now following the behavior of the Shanghai Index.
In the future, historians will discuss how and why this shift in global market correlation has developed and its importance in indicating the shift in economic power. The reasons for this change in global market behavior relationships are less important than recognizing the change. Today investors have a simpler task. The correlated behavior is clear, so by watching the Shanghai Index, investors can develop more effective investment strategies for the future behavior of the Dow Index and for those markets which continue to follow the Dow.
The author is an international financial technical analysis expert, an equity and derivatives trader and author of many books on trading techniques. He appears regularly on CNBCAsia and is known as "The Chart Man".