


We have launched E-mail Alert service,subscribers can receive the latest catalogues free of charge

China's Control over Environmental Pollution: Retrospects and Prospects
2012-12-28


By Chen Jianpeng & Li Zuojun, Research Institute of Resources and Environment Policies of DRC
Research Report No 168, 2012
Since the turn of the 21st century, progress has been made in China's control over environmental pollution. However, pollution still increases on the whole currently in China, making the control of the environmental pollution not optimistic. Based on relevant data1 and authoritative studies2 made in recent years and in line with the investigations and researches into the control exercised by various localities over environmental pollution, this report reviews in retrospects the control over environmental pollution carried out since the 21st century and, in the meantime, it looks ahead to the environmental pollution in the coming 10 years and even a longer period of time.
I. Basic Conditions of the Environmental Pollution Control in China since the 21st Century
1. Growth of major. pollutants discharged has been held in check in the main
(1) The growth of total COD discharged has been basically held in check During 2001~2010, the total amount of chemical oxygen demand (COD) discharged from waste water nationwide showed a downward trend on the whole, dropping from 14.048 million tons in 2001 to 12.381 million tons in 2010. Of this total, COD discharged from industrial chemicals decreased, from 6.075 million tons in 2001 to 4.348 million tons in 2010; COD from domestic chemicals increased slightly from 7.973 million tons in 2001 to 8.895 million tons in 2006, and then down to 8.033 million tons in 2010. During the 10th Five-Year Plan period, COD discharged from waste water nationwide increased instead of decreasing, leaving the targets set forth in the 10th Five-Year Plan unfulfilled. During the 11th Five-Year Plan period, the total amount of COD discharged respectively from waste water, industrial waste water and domestic sewage showed a downward trend on a yearly basis. In 2010, the amount of total countrywide COD emissions dropped by 12.5% over 2005, outperforming the overall emission reduction task set in the 11th Five-Year Plan3.
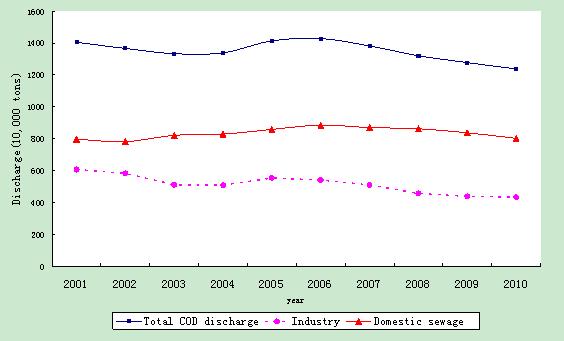
Figure 1 Nationwide COD Discharge During 2001~2010
Source: 2009 China Environmental Statistical Annual Report, 2010 China Environmental Statistical Annual Report.
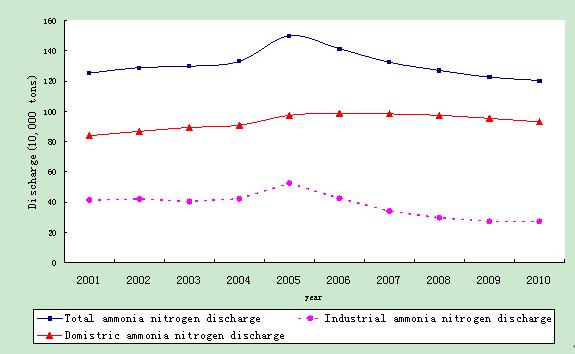
Figure 2 Nationwide Ammonia Nitrogen Discharge from Waste Water During 2001~2010
Source: 2009 China Environmental Statistical Annual Report, 2010 China Environmental Statistical Annual Report.
(2) The total ammonia nitrogen discharge has been basically held in check
During 2001~2010, the waste-water-incurred aggregate ammonia nitrogen discharge increased before decreasing, up from 1.252 million tons in 2001 to 1.498 million tons in 2005 and then down to 1.203 million tons in 2010. Of this total, the industrial ammonia nitrogen discharge decreased steadily, from 413,000 tons in 2001 to 273,000 tons in 2010. The ammonia nitrogen discharged from daily life increased by a slim margin, from 839,000 tons in 2001 to 930,000 tons in 2010.
(3) Total sulfur dioxide discharge has become stable
During 2001~2010, the nationwide total sulfur dioxide discharge from exhaust gases went up before going down. During the 10th Five-Year Plan period, the total sulfur dioxide discharge went up steadily, from 19.478 million tons in 2001 to 25.888 million tons in 2005, leaving the emission reduction targets of the 10th Five-Year Plan unfulfilled. During the 11th Five-Year Plan period, the nationwide sulfur dioxide discharge from exhaust gasses, the sulfur dioxide discharge from industrial exhaust gases and the domestic sulfur dioxide discharge all went down on a yearly basis. In 2010, the nationwide sulfur dioxide discharge dropped by 14.3% as compared to 2005, overfulfilling the emission reduction tasks set in the 11th Five-Year Plan4.
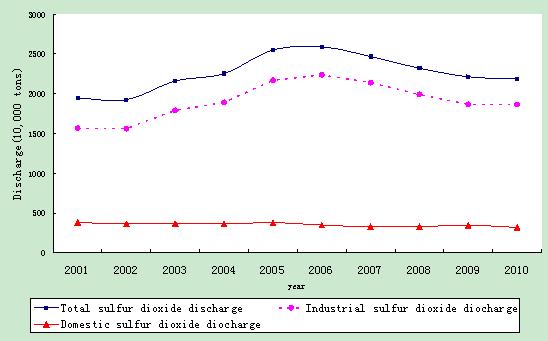
Figure 3 Sulfur Dioxide Discharge During 2001~2010
Source: China Environmental Statistical Annual Report 2009, China Environmental Statistical Annual Report 2010.
(4) Smoke and dust discharge has been effectively held in check
During 2001~2010, industrial dust decreased steadily, from 9.906 million tons in 2001 to 4.487 million tons in 2010. During 2001~2010, smoke discharge increased steadily before decreasing steadily. Of this process, during 2001~2005, smoke discharge increased from 10.698 million tons in 2001 to 11.825 million tons in 2005, and then decreased with each passing year, from 10.888 million tons in 2006 to 8.291 million tons in 2010.
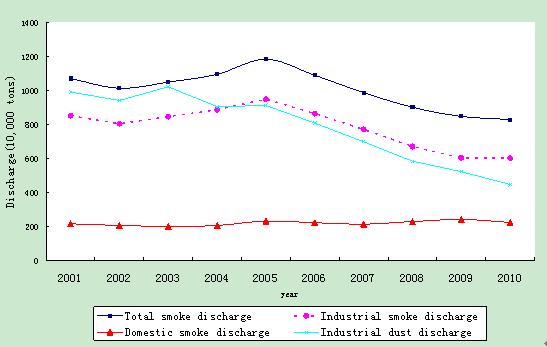
Figure 4 Smoke and Industrial Dust Discharge Nationwide During 2001~2010
Source: China Environmental Statistical Annual Report 2009, China Environmental Statistical Annual Report 2010.
2. Great progress has been made in the construction of environmental protection infrastructure, yet on an overall low level
(1) Urban sewage and garbage treatment has developed rapidly
During 2001~2010, the nationwide urban sewage treatment developed rapidly. The number of urban sewage treatment plants increased with each passing year from 452 in 2001 to 1,444 in 2010. The treatment rate of domestic sewage went up from 36.43% in 2001 to 82.31% in 2010. During the same period, the number of countrywide county sewage treatment plants increased from 54 in 2001 to 1,052 in 2010. The nationwide county sewage treatment rate went up from 8.24% in 2001 to 60.12% in 2010. The number of nationwide urban garbage hazard-free treatment plants increased from 419 in 2006 to 628 in 20105.
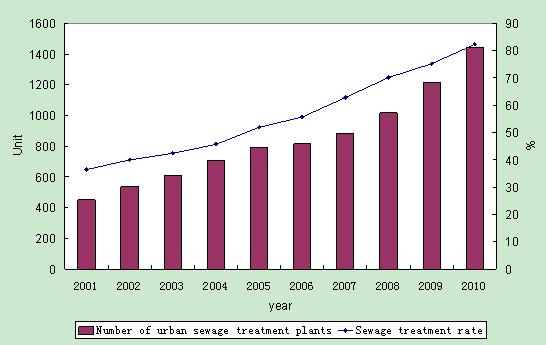
Figure 5 Number of Nationwide Sewage Treatment Plants and the Sewage Treatment Rates During 2001~2010
Source: China Urban-Rural Construction Statistical Yearbook 2010.
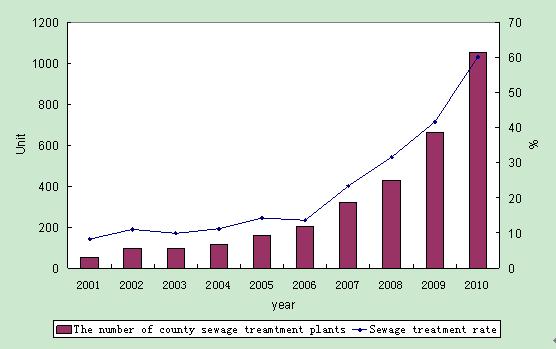
Figure 6 Number of Nationwide County Sewage Treatment Plants and the Sewage Treatment Rates During 2001~2010
Source: China Urban-Rural Construction Statistical Yearbook 2010.
(2) Construction of village and township sewage treatment infrastructure facilities lags far behind
The construction of nationwide village and township sewage treatment infrastructure facilities lags far behind. As of 2010, there had only been 1,625 sewage treatment plants in 19,410 administrative towns nationwide and 123 sewage treatment plants in 14571 villages6.
3. Environmental protection investment has increased steadily and pollution supervision has been improved
(1) Investment in environmental protection has increased steadily
During 2001~2010, the amount of investment in environmental protection increased year by year, and the proportion of the investment in GDP enlarged steadily. The total amount of pollution control investment increased from 101.03 billion yuan in 2000 to 665.42 billion yuan in 2010. The proportion of environmental protection investment went up from 1.02% to 1.66% in 2010.
…
If you need the full text, please leave a message on the website.
1The data come from: China Environmental Statistic Yearbook, China Annual Environmental Statistical Report, China Statistical Yearbook of Urban-Rural Construction and Data from the General Survey of Pollution Sources (An Anthology of the First General Survey of Countrywide Sources of Pollution).
2The studies include: Macro-Strategic Study of China Environment (Comprehensive Reports) (2011 Edition), Analysis and Prediction of Environmental and Economic Situations of China’s Major Industries Oriented Toward Energy Conservation and Emission Reduction During 2009~2020 and A 2011~2020 Research Report on Analysis and Prediction of the Lists of Unconventional Control over Pollutant Discharge.
3The COD Discharge total was targeted at a reduction of 10% during the 11th Five-Year Plan period.
4The 11th Five-Year Plan was targeted at a reduction of 10% of the total sulfur dioxide discharge.
5New standards adopted since 2006.
6Source: China Urban-Rural Construction Statistical Yearbook 2010.