


We have launched E-mail Alert service,subscribers can receive the latest catalogues free of charge

An Evaluation on China’s Trade Dependence Ratio
2000-08-08


Long Guoqiang
Research Report No 66, 2000
China’s trade dependence ratio has been on the rise in the past 20 years. As a result, a sense of anxiety appeared domestically: an exceedingly high trade dependence ratio might have an adverse effect on the healthy development of China’s economy. With China’s forthcoming entry to the World Trade Organization, whether we maintain a correct understanding of trade dependence ratio will directly affect our assessment of various situations and the adjustment of our opening-up strategy. Making an international comparison of China’s trade dependence ratio by scientific methods and arriving at a correct understanding is of both theoretical and important practical significance.
I. Evolution of China’s trade dependence ratio
Trade dependence ratio of a country is the ratio of the total amount of foreign trade of that country to its gross domestic product (GDP). The ratio is used to measure the degree of dependence of a country’s economy on the international market. Foreign trade is divided into export and import. Correspondingly, trade dependence ratio can be divided into two categories: degree of dependence upon export, i.e. the ratio of export amount to GDP; and degree of dependence upon import, i.e. the ratio of import amount to GDP. In practical work people tend to pay greater attention to export dependence ratio. Compared to trade dependence ratio, it lays greater emphasis on the locomotive effect it has on economic development. It can also avoid double counting of import and export trade values. From a long term point of view, the export and import of a country tend to balance themselves. Henceforth, taking one into consideration would suffice.
As a result of the tremendous efforts exerted in opening up China to the outside world in the past 20 years, China’s foreign trade grew by leaps and bounds. According to customs statistics, from 1981 through 1999, the average annual growth rate of China’s total import and export volume reached 12.40 percent, while export grew at an average annual rate of 12.90 percent and import at 11.90 percent. The position China occupied in world export and import rose from number 32 when reform and opening up was initiated to number 9 and 10 respectively. Among developing countries China became one of the few winners in the process of economic globalization. At the same time, in the years before 1994 the Renminbi (RMB) devalued steadily. It started in 1981 at 1 US dollar to 1.70 RMB yuan and ended in 1994 at 1 US dollar to 8.70 RMB yuan. The exchange rate in 1999 was 1 US dollar to 8.28 RMB yuan. Correspondingly, China’s trade dependence ratio rose dramatically. It was 9.80 in 1978 and by 1999 it was 36.40. It once reached 40.60 in 1994. The export dependence ratio was 4.60 in 1978 and 19.70 in 1999. The import dependence ratio was 5.20 in 1978 and by 1999 it reached 16.70. (see Chart 1)
The rapid development of the processing trade played an important part in raising the trade dependence ratio. Processing trade takes place when enterprises import raw material and component parts and process them into finished goods for export. It includes “trade of processing imported materials provided” and “trade of processing materials provided by foreign clients”. In the 18 years from 1981 through 1999, the average annual growth rates of China’s export and import was 12.90 percent and 11.90 percent respectively. However, general export and import trade grew at average annual rates of 7.70 percent and 6.80 percent respectively, both lower than the average annual GDP growth rate. On the other hand, the average annual growth rates of export and import of processing trade were as high as 29.50 percent and 26.90 percent respectively, making the ratio of processing trade in the total volume of export and import trade rise from 4.80 percent to 56.90 percent and 37.80 percent respectively. Processing trade has become China’s biggest mode of trading. Though in recent years, both domestic content ratio and rate of added value of processing trade have gone up, a unique feature of the trade remains to a certain extent “import and high export”. It is not deeply integrated with domestic economic operation. As a result, making use of trade dependence ratio which includes the processing trade may to a large extent exaggerate the degree of dependence of China’s economy on the international market.
Chart I Evolution of China’s trade dependence ratio (1978-1999)
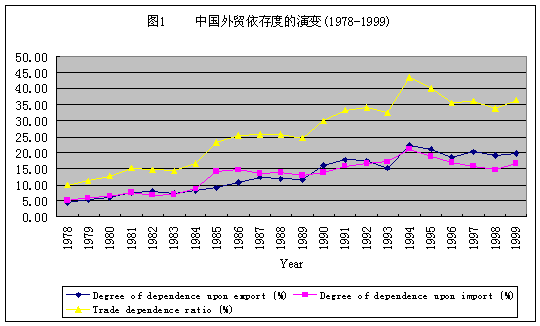
Source: China Statistical Yearbook over the years
II. International comparison of China’s trade dependence ratio community
Theoretically, there is no generally accepted criteria for measuring the appropriateness of trade dependence ratio. Henceforth, to acquire a correct understanding of China’s trade dependence ratio, we must carry out analysis with China placed in the context of the international community and by comparing China with the international community so as to arrive at a convincing conclusion.
First, the continued rise of China’s trade dependence ratio is in conformity with international trends. With the development of economic globalization the growth rate of international trade has been consistently higher than that of the world economy. From 1980 through 1995, the growth rate of international merchandise trade was 5.60 percent. However, the average rate of world economic growth from 1980 through 1990 and from 1991 through 1998 were 3.10 percent and 2.50 percent respectively. As a result, the trade dependence ratio of the economies of the world's most nations and regions in the past several decades had been on the rise. The world’s average degree of dependence upon export rose from 14 percent in 1970 to 25 percent in 1997 (see Chart 2). From a horizontal point of view, the higher the per capita income of a country, the higher the trade dependence ratio of that country (see Table 1). This is another piece of evidence demonstrating that the rise of China’s trade dependence ratio as per capita income rises is in conformity with international trends.
Second, at present China’s trade dependence ratio remains lower than the world average. In 1994, China’s foreign exchange rate devalued by a big margin which in turn caused China’s trade dependence ratio to be higher temporarily than that of the world. Apart from this, China’s trade dependence ratio has been consistently lower than the world average (see Chart 2).
Third, when carrying out comparisons between China’s trade dependence ratio and that of the international community, we should take into consideration the composite difference of the GDP of various countries. Generally speaking, if other factors are the same, the tradable attribute of service industry is much lower than goods. Henceforth, the greater the tertiary industry component in a GDP, the lower the trade dependence ratio. The GDP composition of different countries differs greatly.
...
If you need the full context, please leave a message on the website.