Daryl Guppy
Triangles, cups offer clues to market trends
By Daryl Guppy (China Daily)
Updated: 2010-04-12 09:15
 |
Large Medium Small |
Repeated chart patterns are evidence of the behavioral impact on market activity. The patterns reflect the way people think individually and this behavior is repeated thousands of times when individuals buy or sell stocks. It is human behavior that creates chart price patterns and which makes the patterns so useful as an analysis tool.

Chart patterns do not suddenly appear. They develop over time. They are easy to identify retrospectively on a historical chart, but more difficult to assess as they are developing. There are usually one or two key points that appear to suddenly reveal the chart pattern.
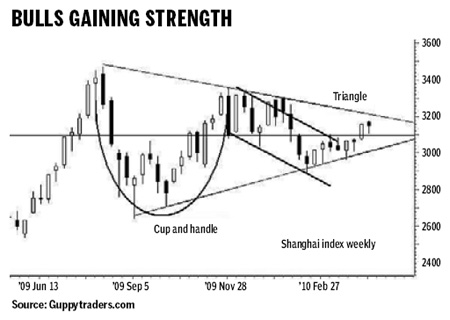
Market analysis using chart patterns is complicated when two patterns develop in a similar time period. Analysts must decide which pattern is more dominant and influential. The Shanghai Index has two long-term patterns. The first pattern identified was the cup and handle. This pattern is best seen on the weekly chart of the Shanghai Index. The handle in this pattern dropped below 50 percent of the height of the cup. This significantly reduced the reliability of the cup pattern. The probability of a successful breakout was reduced. If a breakout did develop, the probability of reaching the pattern target projection level was also reduced.
The second pattern is a longer-term one and has developed over nine months. This is an equilateral triangle pattern. The lower edge of this was not confirmed until last month. The cup and handle develops inside this larger triangle.
The dominant chart pattern in the Shanghai Index is the long-term equilateral triangle. This can be most easily seen on a weekly chart. The equilateral triangle is a pattern of indecision. The market is almost equally balanced between bears and bulls. The bearish pressure is shown by the downtrend line. The bullish pressure is shown by the uptrend line.
| ||||


The triangle pattern can be divided into upper and lower sections. There are two methods to make this division. The first method calculates the value of the base of the triangle. This value is then halved and this forms the centerline of the equilateral triangle. This has a value near 3060. The second method uses the activity within the triangle pattern. An important chart feature in recent weeks has been the development of a resistance barrier near 3100. This is not the exact centerline for the triangle pattern, but it is an important reference point.
The position of the centre line, or resistance line, is important because it helps to determine any bullish and bearish pressure in the triangle pattern. When the two trend lines are extended on the weekly Shanghai index chart they meet at a value of near 3130. The apex of the triangle is above the triangle's center line resistance level. This adds some small bullish pressure to the triangle pattern.
The apex of the triangle pattern does not develop until July this year. For the next several weeks the market may trade inside this long-term triangle pattern. There is a strong probability the market will react away from the value of the downtrend line and retest support in the 3100 area. This is the normal pattern of rally and retreat that has developed in recent months. When the index clusters above the 3100 level in the upper section of the triangle pattern there is a higher probability of a successful breakout developing a new uptrend.
The author is a well-known financial technical analyst.