Daryl Guppy
Volatility: The normal market state of the dollar
By Daryl Guppy (China Daily)
Updated: 2010-09-20 09:48
 |
Large Medium Small |
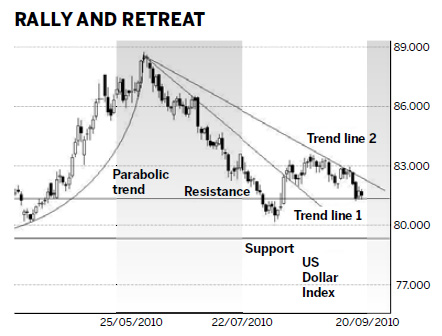
US mid-term elections take place in November. Some politicians and candidates have become obsessed with the idea that a change in exchange rates will solve US trade problems. The US Dollar Index tracks the growth and retreat of confidence in the US dollar. At some times in the pattern of price behavior the US dollar is much cheaper, or more expensive. The US Dollar Index measures the performance of the US dollar against a basket of currencies. These include the euro, Japanese yen, UK pounds, Canadian dollars, Swiss Francs and the Swedish Krona.

The US Dollar Index confirms that volatility is a more normal market condition than stability. It is this volatility that creates trade problems for business, banks and industry. The increase in the speed of volatility is one of the consequences of the global financial crisis.
The US Dollar Index chart highlights the degree of volatility. From March 2009 to December 2009 the index fell from $0.89 to $0.75, or 15 percent. Then it rose 18 percent to $0.885 by June 2010. This rise developed a parabolic trend pattern, which gives early and clear warning of a significant price retreat. The pattern was accurate and the US Dollar Index fell 9 percent from $0.885 to $0.80 in August 2010.
These are large moves. Currency traders have been very pleased with this volatility because it offers many trading opportunities. Banks and business are less happy with the volatility. They are exposed to the currency movements when their customers buy or sell in US dollars. The bank has to take the opposite side of the transaction.
For exporters and importers the currency volatility has a significant impact on profits. There is an increasing requirement for business and government to master the skills of currency hedging.
| |||||||


A rebound from the $0.815 area and a break above the new downtrend line value near $0.825 creates the conditions for a retest of the previous highs near $0.88. There are not any well defined resistance levels between $0.815 and $0.88. The US Dollar Index can move quickly from near $0.81 to near $0.88 when the breakout develops successfully.
The recent upper area of consolidation near $0.835 will create a temporary resistance barrier for a new rally.
Which is better, a strong US dollar or weak US dollar? That is politics. Identifying trend turning points and trading the rally and retreat behavior is the business of the market and market analysis. The US Dollar Index chart helps traders and investors but it does not give solutions for the politics of the currency debate.
The author is a well-known international financial technical analysis expert.