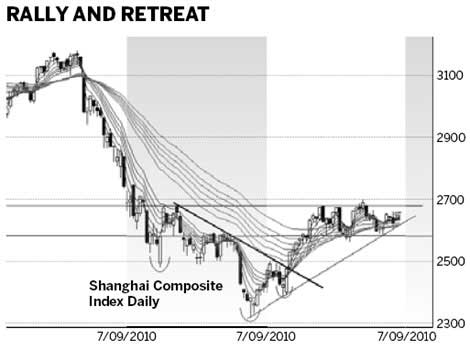
- The inverted head and shoulder pattern
- The potential up trend line
- The GMMA relationships
- The trading band or consolidation area
- The developing pattern of rally and retreat in the trend breakout
Daryl Guppy
Sideways trading pattern of index expected to continue
By Daryl Guppy (China Daily)
Updated: 2010-09-06 11:33
 |
Large Medium Small |
The stock market moves in advance of the formal reports of economic activity. Thursday last week the key Purchasing Managers Index (PMI) showed a rebound in August. Other associated reports confirmed the increasing role of domestic demand in supporting economic growth and a move away from heavy reliance on foreign trade for growth.
It's a story that has already reflected in the development of the Shanghai index activity. Investors look to economic reports for confirmation of economic activity. We look to the behavior of the Shanghai index for indications about the future development of the economy.
The Shanghai Index has developed a sideways trading pattern. This is a type of consolidation band that provides the foundation for a trend breakout. The lower level of the consolidation pattern is near 2,580. The upper level of the pattern is 100 index points higher near 2,680. There are five bullish features in the Shanghai Index. They are:
The most important of these are the inverted head and shoulder pattern and the up sloping trend line. The inverted head and shoulder pattern established the long-term bullish environment. The pattern reflects changes in investor sentiment and this leads the formal notification of changed economic conditions that come from economic reports.
This pattern has a high degree of reliability. The pattern does not provide any useful guidance about how the up trend will develop to achieve the pattern targets. The upside target for this chart pattern is near 2,780. The key indication of a continuation of the pattern is a sustained breakout above 2,680.
The new up trend line is not fully confirmed. The up trend line captures the growing confidence in investor behavior. It shows their increasing expectations. When the market falls they enter as buyers. The position of the trend line has been tested three times. The best bullish result is another successful test of the trend line followed by a rebound and move above resistance near 2,680. If the trend line test is unsuccessful then the market will continue to move in the sideways trading pattern. This is bullish, but a successful test of the trend line is more bullish.
The development of the Guppy Multiple Moving Average (GMMA) relationships is bullish. This indicator tracks the behavior of investors and traders. The longer group of averages shows the behavior of investors. This group has compressed and turned upwards. The short-term group of averages shows the behavior and thinking of traders. This group has twice tested and retested the support from the long-term group. These successful tests confirm investors have confidence in the market. When traders became nervous and began to sell the investors have confidence and they move into the market as buyers. This activity is shown by the continued up trend in the long term GMMA.
The most important evidence of a developing bullish market is when the index close above 2,680 and then uses this level as a support rebound level. This trend breakout is confirmed when the long term GMMA moves upwards more quickly and begins to develop good separation. This shows investors are very bullish and support the new up trend.


This volatility contains the pattern of rally and retreat that is usually associated with a market trend breakouts. Markets are slow to develop a full change in trend direction. There are many tests and retests of the new uptrend before the successful trend breakout is confirmed.
Failure of support at 2,580 is bearish and the market can quickly fall to support near 2480. This would confirm a wider trading consolidation band between 2480 and 2680. This could develop as part of a longer term "W" shaped recovery.
The market anticipates changes in economic activity and the market provides an early indication of the current economic condition that is later confirmed with economic reports.
The author is a well-known international financial technical analysis expert.