China Integrated City Index 2022: Core cities lead development of megalopolises


Editor's note: In China, which city and which megalopolis is most developed? In the recently released China Integrated City Index 2022, Cloud River Urban Research Institute utilizes the comprehensive ranking deviation values to quantitatively define first-tier cities, quasi first-tier cities, second-tier cities, and third-tier cities and conducts a comprehensive evaluation of 19 megalopolises.
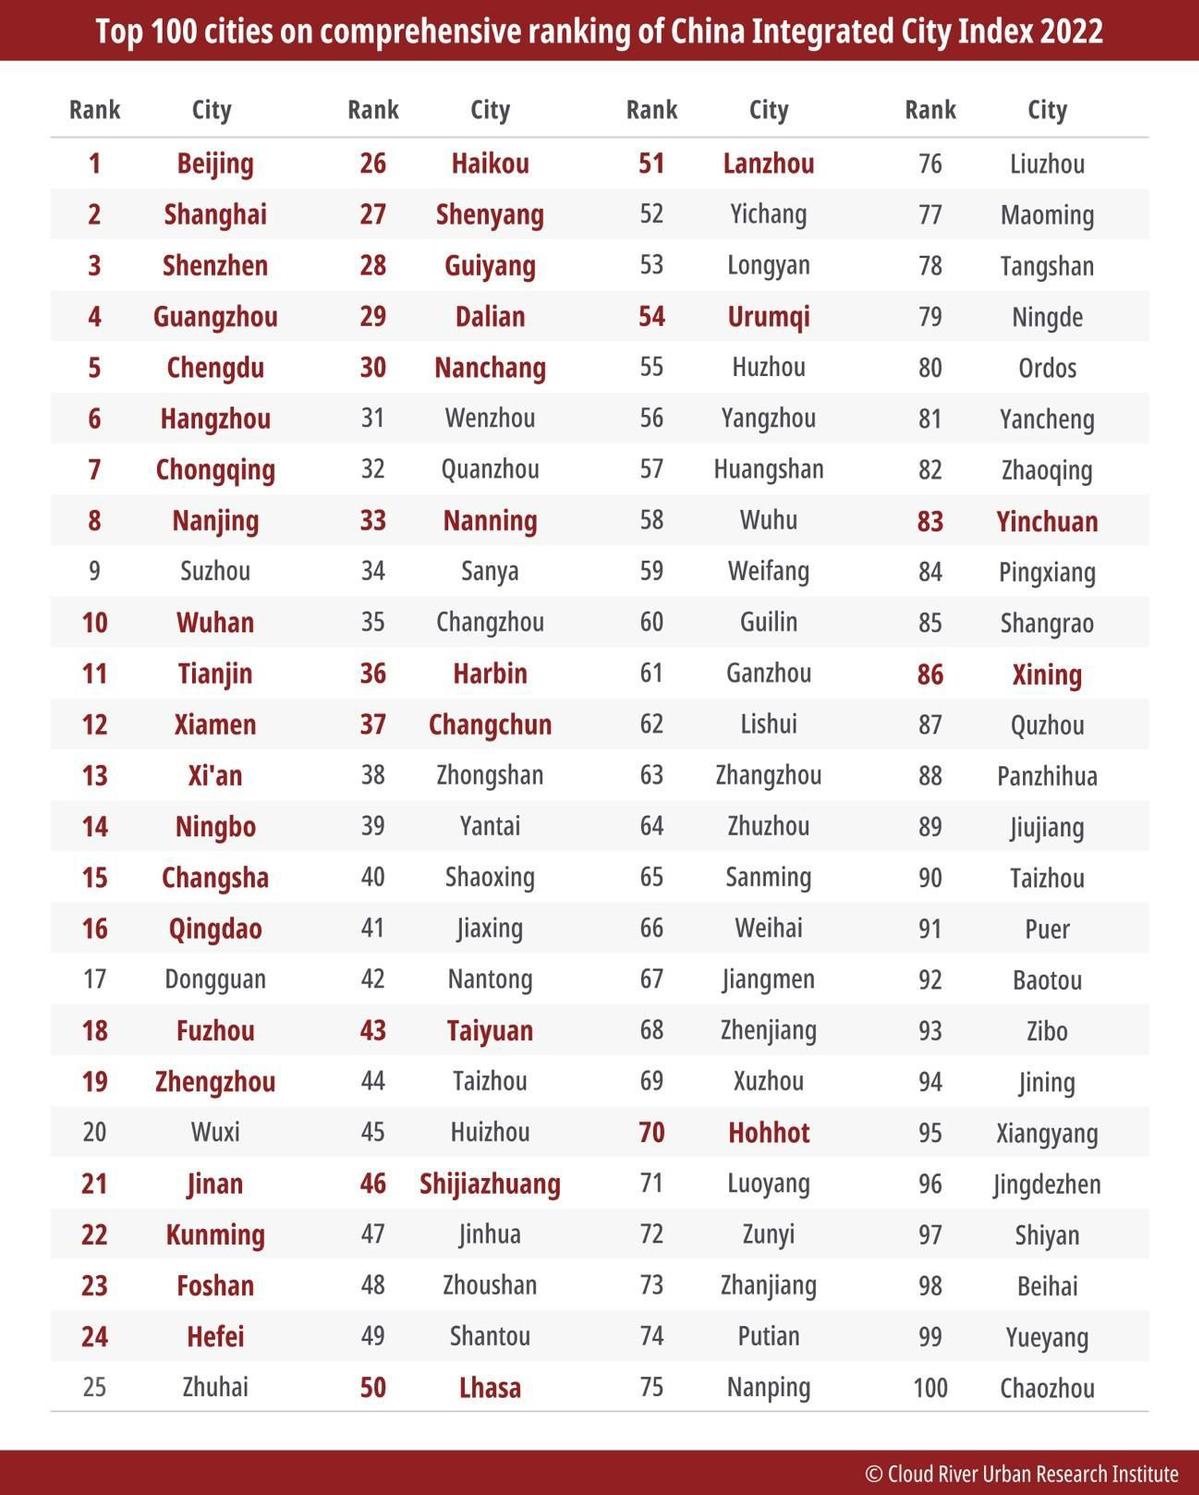
Beijing secured the top spot for the seventh consecutive year on the comprehensive ranking of the China Integrated City Index 2022, followed by Shanghai in second place and Shenzhen in third.
Zhao Qizheng, former minister of the State Council Information Office, said, "In 2022, the international climate was complex and volatile and the COVID-19 pandemic repeatedly surged. Despite these challenges, China's economy achieved stable growth. The China Integrated City Index 2022 puts China's urban development in the global perspective."
Ming Xiaodong, former first-level inspector of the Department of Development Planning of the National Development and Reform Commission and former minister-counsellor of the Chinese Embassy in Japan, said, "The year 2022 was an extraordinary year for China, as the Chinese economy achieved stable growth, bucking the adverse effects of the international environment and the COVID-19 pandemic."
"The China Integrated City Index 2022 profoundly reveals the economic growth trend and the comprehensive development of Chinese cities in 2022. Beijing, Shanghai, Shenzhen, Guangzhou, Chengdu, Hangzhou, Chongqing, Nanjing, and Suzhou maintain their rankings in the top nine, compared to the previous year. This indicates that the growth engine and driving force of the Chinese economy have not changed."
"These cities, as the backbone of China's economic growth, maintained sustained economic and social development despite pressures brought by the repeating outbreaks of the pandemic and disrupted supply chains in 2022. Driven by good showings of these cities, China's economy hit new highs, surpassing the 120 trillion-yuan threshold. Among the top 10 in the comprehensive ranking, only Wuhan, in 10th place, is a newcomer. This demonstrates that Wuhan has overcome the impact of the pandemic and has made its way into the top 10."
Top 100 cities on comprehensive ranking of China Integrated City Index 2022
1. Who are first-tier, quasi first-tier, and second-tier Chinese cities?
Opinions vary about which cities are considered first-tier and second-tier. There even emerged new first-tier cities in China. However, there is not any clear definition of the hierarchical classification of Chinese cities. Yang Weimin, former deputy director of the Office of the Central Leading Group for Financial and Economic Affairs of China, explained that there is not yet a strict criterion for classifying cities and it is some people who classify cities according to their housing prices.
Given this situation, the China Integrated City Index 2022 (hereinafter referred to as the Index) puts cities across the country into different tiers, comprising 878 data sets based on a comprehensive evaluation of 297 cities at the prefectural level and above in terms of environmental, social, and economic dimensions.
The Index uses the concept of "deviation value" in the evaluation method to look into each city's position relative to other cities nationwide on each indicator. It converts different units used in different indicators into a unified scale for comparison. The total comprehensive evaluation deviation value consisting of the deviation values of three major categories - the environment, society, and the economy - is 300, with a national average of 150.
According to the Index, cities with a deviation value above 200 are defined as first-tier cities; cities with a deviation value of 175-200 are defined as quasi first-tier cities; cities with a deviation value of 150-175 are defined as second-tier cities; and cities with a deviation value below 150 are defined as third-tier cities.
According to this criterion, Beijing, Shanghai, Shenzhen, and Guangzhou are first-tier cities, among which Beijing and Shanghai stand out with much higher deviation values.
Quasi first-tier cities include nine cities, namely Chengdu, Hangzhou, Chongqing, Nanjing, Suzhou, Wuhan, Tianjin, Xiamen, and Xi'an. Given that urban development is dynamic, these quasi first-tier cities are the most likely to become first-tier cities in the future.
Second-tier cities include 43 cities, led by 21 core cities. Among them, the deviation values of cities like Ningbo, Changsha, Qingdao, Dongguan, and Fuzhou approach 175 and are expected to enter the echelon of quasi first-tier cities in the near future.
There are a total of 241 third-tier cities with comprehensive evaluation deviation values below the national average. Particularly noteworthy is that three provincial capitals, namely Hohhot, Yinchuan, and Xining, are among them.
Zhao Qizheng argued that using the comprehensive ranking deviation value to quantitatively define first-tier cities, quasi first-tier cities, second-tier cities, and third-tier cities clarifies the classification standards of these four types of cities and avoids the difficulty of comparing different opinions.
2. Three major megalopolises serve as biggest driving force of China's economy
Megalopolises are the primary form of China's new type of urbanization. According to the 14th Five-Year Plan (2021-25), 19 megalopolises have been planned nationwide. The plan aims to upgrade megalopolises such as the Beijing-Tianjin-Hebei region, the Yangtze River Delta, the Pearl River Delta, the Chengdu-Chongqing Economic Circle, and the middle reaches of the Yangtze River, develop megalopolises including the Shandong Peninsula, coastal areas of Guangdong, Fujian, and Zhejiang provinces, the Central Plains, the Guanzhong Plain, and the Beibu Gulf, and foster megalopolises like Harbin-Changchun, Central and Southern Liaoning, Central Shanxi, Central Guizhou, Central Yunnan, Huhhot-Baotou-Ordos-Yulin, Lanzhou-Xining, Ningxia along the Yellow River, and the north slope of Tianshan Mountains. These 19 megalopolises encompass 35 national or regional core cities, which contribute 88% of China's GDP and housing 81.9% of China's permanent population.
Evaluating the development of megalopolises is of great significance. Compared to the China Integrated City Index 2021 which evaluated the top 10 megalopolises, the 2022 edition expands the evaluation to include all 19 megalopolises.
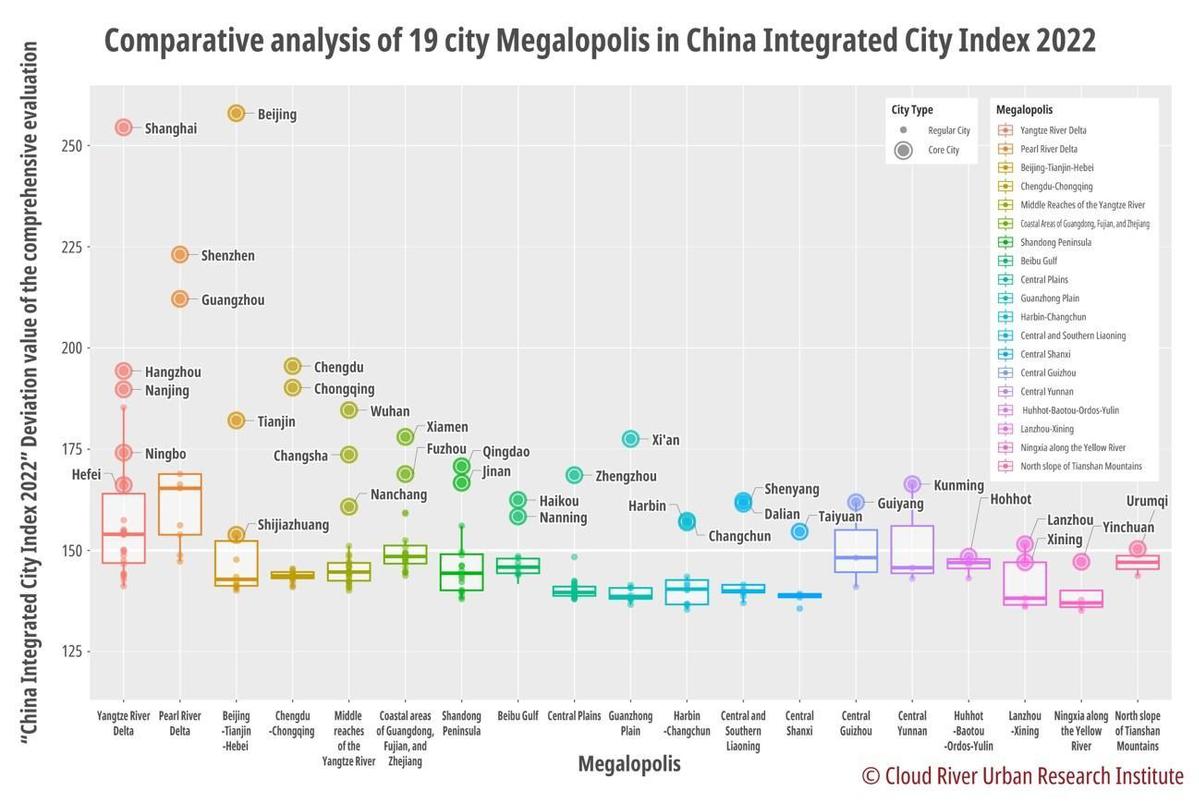
To provide a clear analysis of the development levels of each megalopolis, this article presents box plots and beeswarm plots of the comprehensive evaluation deviation values of 223 cities covered by the 19 megalopolises, categorized by the type of megalopolises. This clearly shows the distribution and degree of differences in the comprehensive evaluation deviation values of cities within each megalopolis
The horizontal line inside the box of a box plot represents the median of the sample, the top of the box represents the upper quartile (75%), the bottom of the box represents the lower quartile (25%), and the box indicates the distribution of 50% of the sample. The beeswarm plot is a statistical chart that illustrates the distribution of individual data points, and mapping a beeswarm on top of a box plot can simultaneously show the position of each sample and the overall distribution of the sample.
Ming Xiaodong said, "Looking at the box beeswarm plot of the comprehensive rankings of the 19 megalopolises, the polarization effect of core cities in the megalopolises is evident. The more developed the region, the higher the ranking of the regional core cities."
Indeed, core cities are the center of large megalopolises. Analysis of the boxswarm plot shows that the four first-tier cities are concentrated in the Yangtze River Delta, the Pearl River Delta, and the Beijing-Tianjin-Hebei region. These three major megalopolises can be referred to as "first-tier megalopolises." The three major megalopolises contribute 36.2% of China's GDP and account for 23.5% of China's permanent population. The per capita GDP in these three major megalopolises is 1.54 times the national average. These megalopolises have attracted a large inflow of people, with a permanent population without local household registrations reaching 78.02 million. Undoubtedly, the three major megalopolises are the most significant engines leading China's economic and social development.
Comparative analysis of 19 megalopolises in China Integrated City Index 2022
3. Who are China's quasi first-tier, second-tier, and third-tier megalopolises?
Megalopolises led by quasi first-tier regional core cities include the Chengdu-Chongqing Economic Circle, the middle reaches of the Yangtze River, coastal areas of Guangdong, Fujian, and Zhejiang provinces, and the Guanzhong Plain, which can be referred to as "quasi first-tier megalopolises."
These four quasi first-tier megalopolises contribute 24.9% of China's GDP and make up 25.7% of the permanent population. This means these megalopolises sustain a quarter of China's economy and population. However, due to the fact that the per capita GDP of these four quasi first-tier megalopolises is only 97% of the national average, they suffer from population outflows totaling 18.01 million people. It's worth noting that the Guanzhong Plain megalopolis is a single-engine megalopolis with Xi'an serving as the only regional core city.
Megalopolises led by second-tier regional core cities are the Shandong Peninsula, the Beibu Gulf, the Central Plains, Harbin-Changchun, Central and Southern Liaoning, Central Shanxi, Central Guizhou, Central Yunnan, Huhhot-Baotou-Ordos-Yulin, Lanzhou-Xining, Ningxia along the Yellow River, and the north slope of Tianshan Mountains, which can be referred to as "second-tier megalopolises."
These 10 second-tier megalopolises contribute 24.8% of China's GDP and account for 31.4% of China's permanent population. This means they support a quarter of China's economy and a third of China's population. Among them, five megalopolises, namely Central and Southern Liaoning, Central Shanxi, Central Guizhou, Lanzhou-Xining, and the north slope of Tianshan Mountains, have absorbed a total of 6.66 million permanent residents without local household registrations. The Shandong Peninsula, the Beibu Gulf, Central Plains, Harbin-Changchun, and Central Guizhou collectively have seen an outflow of 37.15 million people. In the second-tier megalopolises, Central Plains, Central Shanxi, Central Guizhou, Central Yunnan, and the north slope of Tianshan Mountains are all single-engine megalopolises with only one regional core city.
Huhhot-Baotou-Ordos-Yulin and Ningxia along the Yellow River are two megalopolises led by only third-tier regional center cities, and they can be referred to as "third-tier megalopolises." Although these two third-tier megalopolises are smaller in volume and scale, with GDP and permanent population accounting for only 2% and 1.3% of the national total, respectively, their per capita GDP is close to levels of the three major megalopolises and 1.53 times the national average. They have collectively attracted a mobile population of 2.31 million. Both of these third-tier megalopolises are single-engine megalopolises with only one regional center city.
Professor Zhou Muzhi, head of Cloud River Urban Research Institute, said, "Using the comprehensive deviation value to quantitatively classify cities and further analyze the development of megalopolises is a new attempt in the Index."
He said he hopes it can help objectively understand the positions and shortcomings of Chinese cities and megalopolises.
Zhao Qizheng lauded comprehensively classifying megalopolises as an innovative attempt.
Ming Xiaodong noted, "We were surprised and happy to find that the Index was released earlier than previous years. It is no longer an index based on the development of Chinese city two years before. Instead, it is review of the previous year's comprehensive development of Chinese cities."
"Especially, the application of the Index continues to expand, covering the economy, society, the environment, and other fields. It goes from comprehensive city comparisons to megalopolis comprehensive comparative analysis, from international top brand consumption comparison to carbon dioxide emission analysis, and from industrial structure comparison to global sci-tech cluster comparative analysis."
"We have reason to believe that as long as brought into good use, the Index has unlimited potential applications."
Zhao Qizheng emphasized, "The 2021 edition has further leveraged the characteristics of comparative research, not only comparing cities at the same level but also making comparisons of megalopolises. This has provided inspirations for those emerging megalopolises devising plans."
Yang Weimin summarized, "China's economy has resilience as a strong economy and such resilience is shown through in its rapidly growing super-large and extra-large cities. Cloud River Urban Research Institute's China Integrated City Index 2022 proves this resilience."
"What's more creative is that the Index for the first time used statistical methods to quantify 878 sets of indicators into a unified dimension - deviation value. It used deviation values to classify first-tier, second-tier, quasi second-tier, and third-tier cities, solving the problem of how to classify first-tier cities, second-tier cities, and third-tier cities in a scientific way."
"This method is very meaningful. The Index is a 'health checkup' for China's urban development and Chinese cities and megalopolises."


- Chengdu man receives suspended sentence for buying endangered turtle specimen
- Wedding platform in china offers hefty salary for 'wedding surrogate' role
- Co-location boosts rural vitalization in Shandong
- New draft law requires improvement of energy development
- Chongqing Library expert educates students in book restoration techniques
- Xi Jinping on his love of books